EUR/USD Forms a Perfect Bearish Reversal Pattern on the Daily Chart


EUR/USD was bullish during the second half of February as it climbed from 1.12302 to 1.1420s. But, it met the 100 SMA (green) up there which has been providing resistance before, and it became much harder for the buyers to push higher. They have broken this moving average twice in January but the price has returned down and the downtrend has progressed.
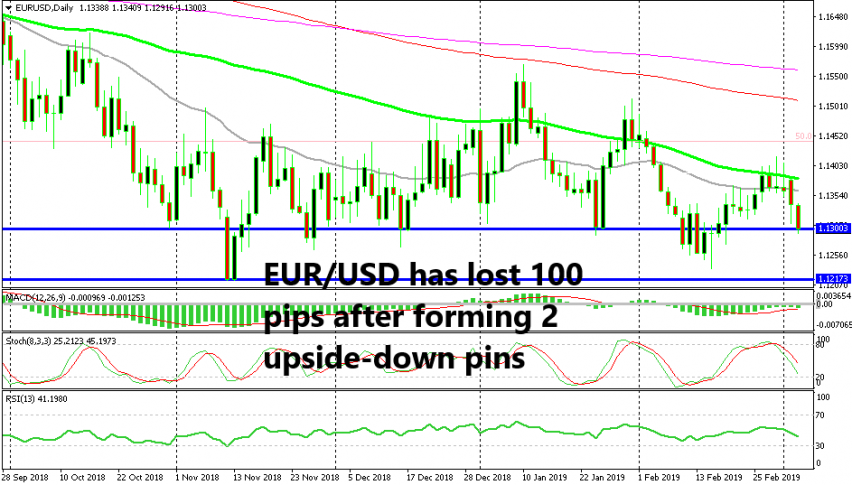
This time, they managed to pierce the 100 SMA which was standing at 1.1390 last week, but none of the candlesticks closed above it, so neither of them was a proper break. In fact, those two candlesticks which pierced the 100 SMA before the last two bearish ones closed as dojis. They’re strong reversing signals.
And, we saw this pair reverse on Monday. US politics gave it the first leg lower as the sentiment deteriorated and then the impressive US non-manufacturing report yesterday gave it the second push. The price broke the 1.13 level yesterday, so the bearish setup looks to be working well. If you are already short on EUR/USD, things look good for you.