Gold Overcomes the 50 SMA as the Previous Resistance Turns Into Support
Gold has broken above last week's range and the 50 SMA, which should turn into support now
GOLD made a big break in January, pushing above the big round level at $1,300. The momentum continued further in February as buyers pushed to $1,346, but then it formed a bearish reversing chart setup on the daily time-frame and turned bearish after that.
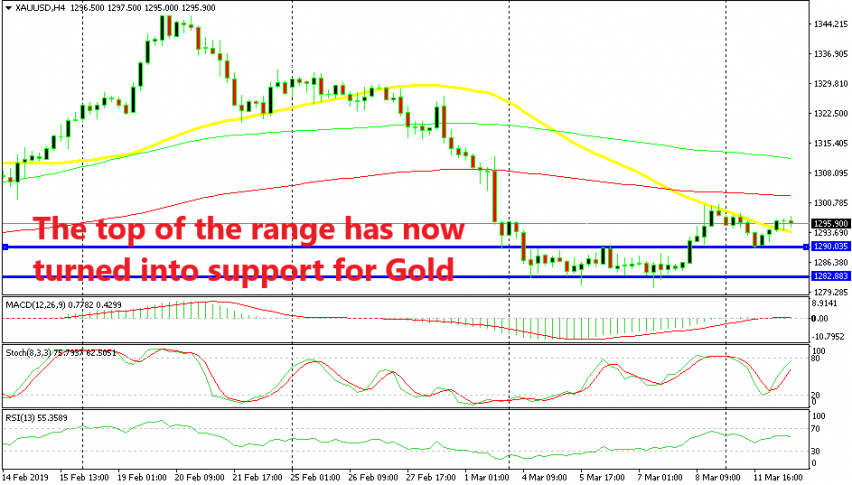
Last week Gold declined to $1,280 but the sellers couldn’t push lower and Gold traded in a tight range for most of the week. The top of that range came at $1,290, which was broken late in the week as the sentiment turned negative on the ECB growth and inflation downgrade. Safe havens benefit when the sentiment turns negative and, as a result, Gold pushed higher, while USD/JPY slipped lower.
But, the 50 SMA (yellow) provided resistance on the H4 chart and pushed the price lower as it headed lower too. But, the previous resistance at around $1,290 turned into support yesterday and we saw the price bounce off of it exactly when the stochastic indicator became oversold. I should have seen this and should have pulled a trade from this setup, but missed the chance as the reverse took place late in the evening.
The price broke above the 50 SMA this time and now this moving average should turn into support. Although, I’m not sure I want to go long from there. I will probably go long from the previous resistance which has now turned into support when the price slips down there. By that time, stochastic will be oversold again and the 50 SMA will have reached the $1,290 level since it is still moving lower.
- Check out our free forex signals
- Follow the top economic events on FX Leaders economic calendar
- Trade better, discover more Forex Trading Strategies
- Open a FREE Trading Account
- Read our latest reviews on: Avatrade, Exness, HFM and XM
Related Articles


Sidebar rates
Related Posts
