Long on S&P at the 100 SMA Again
S&P500 has retraced down to the 100 SMA again where we decided to open another buy trade
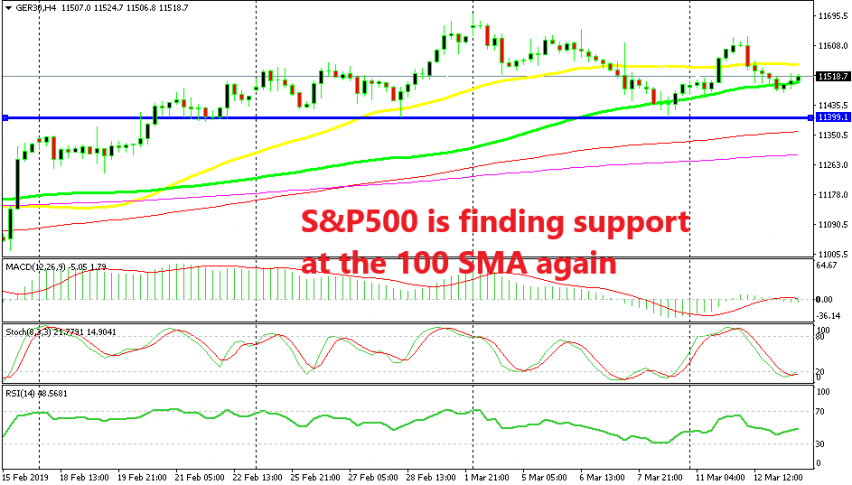
Last week we opened two buy signals in S&P500 as this index was retracing lower, once at the 50 SMA (yellow) on the H4 chart and once at the 100 SMA (green). We lost the signal we opened at the 50 SMA after sellers broke that moving average and pushed the price lower to the 100 SMA, but won the other signal.
Actually, we closed the second signal a bit prematurely when the price reached the 50 SMA after bouncing off the 100 SMA. But I thought that the 50 SMA would provide resistance and reverse the price back down to the 100 SMA where I could open another buy signal.
We pocketed around 100 pips from the second signal but could have made twice that. Anyhow, no reason to beat ourselves up as the price is now back at the 100 SMA and we have another trade setup for buyers. The price returned down yesterday as the meaningful Brexit vote in the British Parliament hurt the sentiment, thus risk assets retreated lower.
The price formed a few hammer candlesticks on the H4 time-frame last evening, right above the 100 SMA as you can see from the chart above. These sort of candlesticks are bullish reversing signals after the retreat. I see that the price has slipped below the 100 SMA overnight, but it is reversing back up and now is headed towards the 50 SMA (yellow). Stochastic is also oversold and turning higher now, so the pullback lower is complete. Seems like a good trade so far, let’s wait.
- Check out our free forex signals
- Follow the top economic events on FX Leaders economic calendar
- Trade better, discover more Forex Trading Strategies
- Open a FREE Trading Account


