USD/CAD Has a Solid Base to Lean on
USD/CAD tried for the second time to break the 100 SMA today but it found support and bounced from it
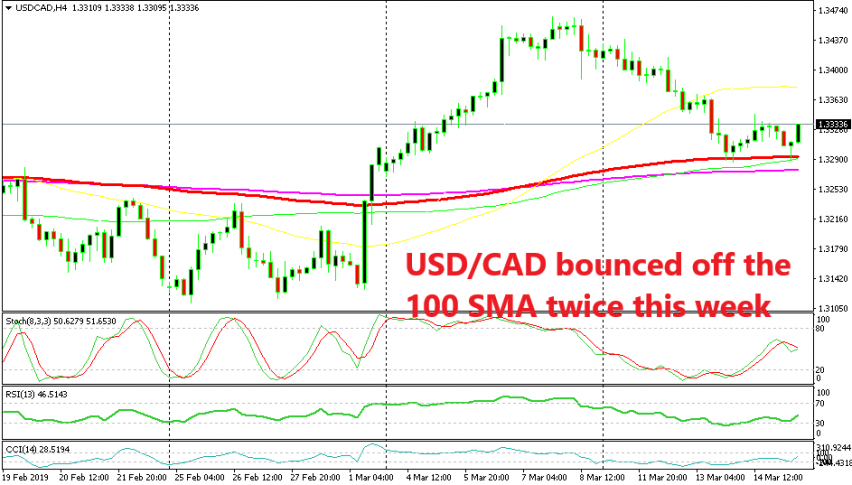
[[USD/CAD]] has been trading in a range between 1.31 and 1.33 since early January after it turned bearish at the end of December. Although, about two weeks ago we saw a bullish move higher as the price climbed form 1.31 lows to 1.3460s where it reversed down again last Friday after the US non-farm employment change was disappointing.
The price declined nearly 200 pips since last Friday this pair found support at the 100 SMA (red) on the H4 time-frame. This moving average stood its ground well and we saw a 60 pip bounce yesterday as Crude Oil prices climbed higher on talk from Audi Arabia and Iraq to keep production low.
Today we saw another attempt to break below the 100 SMA but it held its ground again during early European session. The price bounced off it and formed a hammer candlestick which is a bullish reversing signal.
The current candlestick looks bullish already, so a bullish reversing setup is complete on this time-frame and if you are long I suggest you keep your position open until the 50 SMA (yellow) at least.
- Check out our free forex signals
- Follow the top economic events on FX Leaders economic calendar
- Trade better, discover more Forex Trading Strategies
- Open a FREE Trading Account
- Read our latest reviews on: Avatrade, Exness, HFM and XM
Related Articles


Sidebar rates
Related Posts
