Gold Moves From One Range to Another
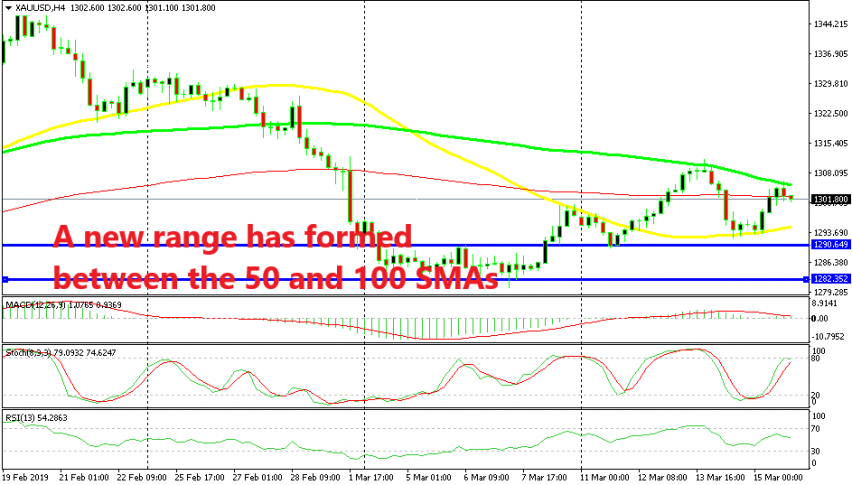
Gold was bouncing between $1,282 and $1,290 last week, but this week it moved the range higher between 2 MAs
We have seen some decent price action in GOLD during January and February which was strange. The price broke above the major level at $1,300 by the end of January and it made another bullish leg in February when it pushed up to $1,346. I say strange because the sentiment was improving in the financial markets during the first two months of this year after the negativity which surrounded markets at the end of last year. Safe havens should have weakened and the JPY did indeed as USD/JPY climbed around 8 cents from the bottom at the beginning of January.
But, Gold turned even more bullish during that time. The reason might have as well been technical as the buyer might have wanted to test the resistance zone. The area from $1,345 to $1,375 is a resistance zone where Gold has reversed and it did reverse lower about four weeks ago from the lower level of that resistance area around the $1,345 and lost $65 in two weeks. But it found support at the $1,280 level last week and it traded inside a range for most of the week, between $1,282 and $1,290. Although, that range was broken towards the end of the week.
The top level at $1,290 was broken but, the 50 SMA provided resistance on Friday on the H4 chart as you can see above. This moving average pushed the price lower but the previous resistance which was the top of last week’s range turned into support now. Gold bounced off the top of the range on Monday and finally broke the 50 SMA.
The price climbed for more than $20 during the next couple of days but another moving average came into play. This time, the 100 SMA (green) provided resistance, reversing the price back down. Yesterday, Gold lost those $20 that it had gained in the previous two days.
The reverse was quite predictable after the upside-down pin candlestick, so that was a lost opportunity to make some good pips, but I digress. The price this time found support at the 50 SMA which provided resistance before. Yesterday GOLD bounced off the 50 SMA and it reversed back up again.
Although, the price found resistance at the 100 SMA for the second time this week, so now we can say that Gold is stuck between the 50 SMA at the bottom and the 100 SMA at the top. As you can see, the technical indicators have been working perfectly for Gold this week, they turn from resistance into support and vice versa. They’re quite useful for trading, so if you are trading Gold, better take into consideration these indicators. Now we can use this new range between these two moving averages until the price makes another break in either direction.
- Check out our free forex signals
- Follow the top economic events on FX Leaders economic calendar
- Trade better, discover more Forex Trading Strategies
- Open a FREE Trading Account


