Selling Gold but There’s A Catch
Gold has finally broken above the 100 SMA but last week's range still remains
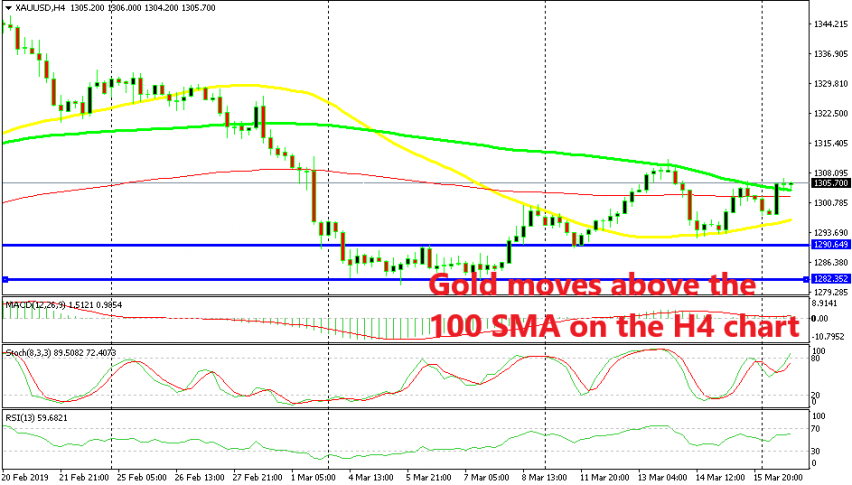
GOLD broke the range that it formed two weeks ago as it declined from the resistance zone which starts at $1,345. The price got stuck in a tight range between $1,282 and $1,290 two weeks ago but finally broke above it at the end of that week and last week Gold also broke above the 50 SMA (yellow) which provided resistance in the first attempt.
Last week, Gold got stuck inside another range between tow moving averages, the 50 SMA at the bottom and the 100 SMA (green) at the top on the H4 time-frame chart. That provided some pretty decent opportunities to trade Gold; buy at the 50 SMA and sell at the 100 SMA.
Today, Gold started the day bearish during the Asian session but turned bullish as the European session got underway. The price moved above the 100 SMA but it hasn’t taken out last week’s high. We decided to go short on GOLD because it is overbought on this time-frame now and the previous candlestick closed as a doji which is a reversing signal.
But, the catch here is that the 100 SMA has now been broken and it is holding the declines, not allowing sellers to make the reverse. Although once it goes, the price will fall pretty fast as the buyers will let go of their positions. Now we are waiting for the 100 SMA to break.
- Check out our free forex signals
- Follow the top economic events on FX Leaders economic calendar
- Trade better, discover more Forex Trading Strategies
- Open a FREE Trading Account