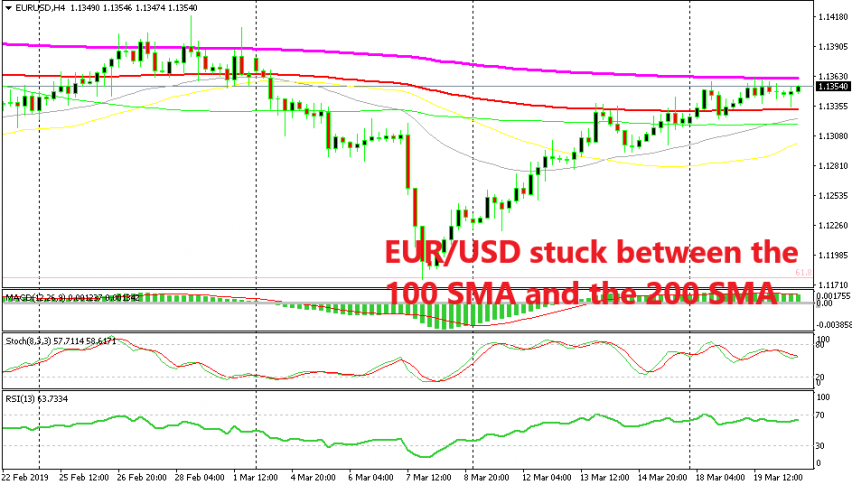
Last week EUR/USD made a swift reversal last week after having made a major bearish trend the week before on a dovish ECB (European Central Bank). This pair kept climbing higher without running into any decent resistance which was pretty strange considering the shift in the ECB the Thursday before.
The price only found resistance at the end of the week at the 100 SMA (red) on the H4 chart. The buyers had a couple of attempts trying to break above it but eventually EUR/USD closed the week below the 100 SMA. The uptrend continued as the new week got underway and the price finally moved above the 100 SMA.
But, another moving average came into play this week. The 200 SMA (purple) has been providing resistance since Monday and the buyers haven’t been able to push above it. But, the sellers haven’t shown themselves either, so we are stuck in this tight range between the 100 SMA at the bottom and the 200 SMA at the top.
The range is only about 30 pips wide, but if you want to trade it, it’s simple, by at the bottom and sell at the top with stops above/below the moving averages, targeting the opposite moving average, until the break comes in either direction. I hope that the break comes to the downside, but that will probably be decided today after the FED meeting.


