Major Charts Point to a Big Bearish Reversal for Bitcoin
Bitcoin has made a retrace higher in recent weeks, but the retrace is complete now on the bigger charts.
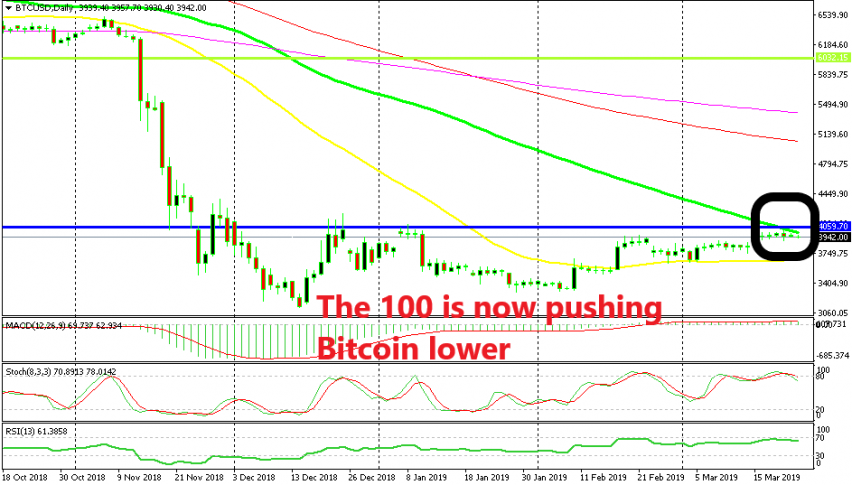
BITCOIN as well as other major cryptocurrencies had a good month in February which was the first bullish month in a long time. This digital currency found resistance at the 50 SMA (yellow) on the daily chart for about a week as you can see above, but the buyers eventually broke above it and the 50 SMA turned into support from then on.
This month, buyers pushed further up again, taking out last month’s high and at the middle of last week they even pushed above the $4,000 level. But, the chart setups in larger time-frames point to a bearish reversal soon. First, Bitcoin didn’t hold above the $4,000 level last week and yesterday the price pushed back below the 200 SMA on the H4 chart. Besides that, the 100 SMA (green) has caught up with the price now on the daily chart and it is already providing resistance.

The weekly chart is overbought too
The last several daily candlesticks have all formed small dojis which are reversing signals. Also, switching to the weekly chart, we see that the 100 SMA (red) has now turned into resistance form support as well. The stochastic indicator has reached the overbought here too, which means that the pullback is complete on the weekly time-frame as well. So, all signs are pointing down on larger time-frame charts, so let’s hope the reversal comes soon since we are short on Bitcoin for about a month now.
- Check out our free forex signals
- Follow the top economic events on FX Leaders economic calendar
- Trade better, discover more Forex Trading Strategies
- Open a FREE Trading Account
- Read our latest reviews on: Avatrade, Exness, HFM and XM
Related Articles


Sidebar rates
Related Posts
