The Trend Shifts in Gold as Support MAs Now Turn Into Resistance
Gold has turned bearish this week and the moving averages are confirming the reversal
GOLD turned bearish in the second half of last month as it reversed down from the bottom of the long term resistance zone around $1,345. It formed a strong bearish reversing setup on the monthly chart which pointed to the downside in the coming months and it still does.
But, the bearish momentum of the last two weeks of February didn’t follow through into March and we have seen Gold price climb higher as the sentiment remains uncertain in financial markets. But, the bullish momentum of this month was not as strong as the previous bearish momentum, which was a sign that the price was going to turn bearish sooner or later. I mentioned it in an article that I posted during the weekend.
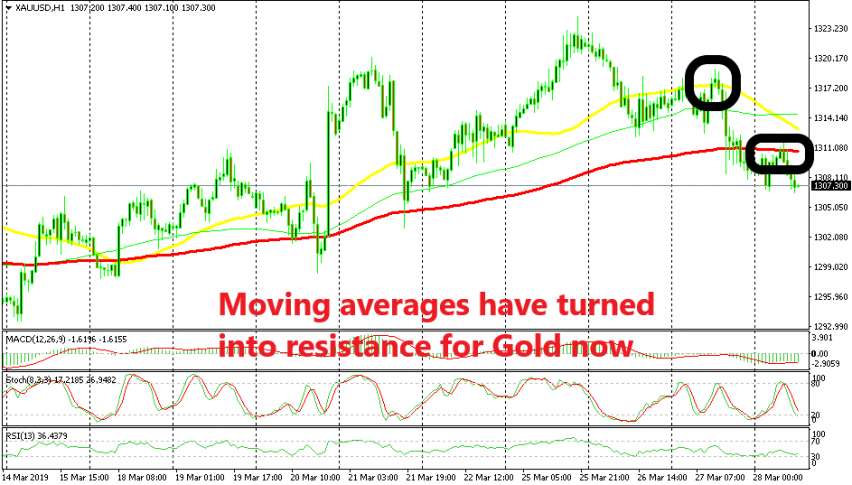
This week, Gold has indeed turned bearish and one of the signs is that the moving averages, which used to provide support on the way up, have now turned into resistance for Gold. The 50 SMA (yellow) was the first to do so on Tuesday and again yesterday and now we see that the 100 SMA (red) has turned into resistance.
It stopped the retrace higher early this morning and the price reversed back down from there. That was a good chance to go short on Gold, but it was too early for European traders, so I missed the opportunity. But, that moving average remains a good place to go short from, so I will keep an eye on it, hopefully we will see another retrace up there.
- Check out our free forex signals
- Follow the top economic events on FX Leaders economic calendar
- Trade better, discover more Forex Trading Strategies
- Open a FREE Trading Account


