Worst Month for Gold – Can Hammer Pattern Trigger Reversal?
The precious metal gold continues to drop on Friday, heading for its worst month since August 2018. The firmer dollar and equities have fade
The precious metal gold continues to drop on Friday, heading for its worst month since August 2018. The firmer dollar and equities have faded the demand for safe-haven investments.
Fundamental Overview
Despite the weaker economic growth in the US economy, the dollar is poised for its biggest monthly gain in five months over positive reversal in the 10-year bond yields.
On the other hand, the Asian shares mounted on hopes that the US and China are making progress in trade talks. The world’s two biggest economies began the new round of negotiations on Thursday to end the year-long tit-for-tat tariffs war.
Thus, the precious metal gold is taking a bearish dip on the stronger dollar the rise in stock market indices. For all the newbies, gold shares a negative correlation with them.
Technical Overview
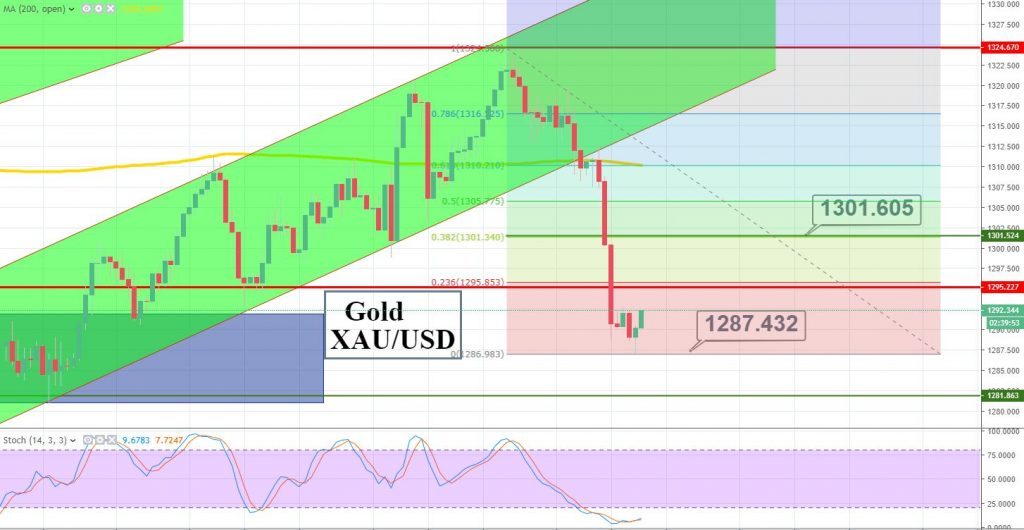
On the 4-hour chart, the violation of the bullish channel has caused massive trouble to gold. The precious metal fell from $1,310 to $1,286 just in two days. But now, the situation is something like this:
- GOLD is trading in the oversold area as the Stochastic is stuck below 8.
- Recently, gold closed a hammer candle right around $1,387. The hammer candles followed by a sharp bearish trend typically reverses the trend to upward.
What’s Next?
At first, gold may go after 23.6% Fibonacci retracement level of $1,295. The violation of $1,295 can trigger further buying in gold until 1,301. On the lower side, the support prevails at $1,287 and $1,281.
Good luck!
- Check out our free forex signals
- Follow the top economic events on FX Leaders economic calendar
- Trade better, discover more Forex Trading Strategies
- Open a FREE Trading Account
- Read our latest reviews on: Avatrade, Exness, HFM and XM
Related Articles


Sidebar rates
Related Posts
