GBP/USD Climbs on Better Manufacturing Numbers but Finds Resistance at the MAs
GBP/USD has turned bullish today, recuperating losses after the 3rd Brexit vote, but it is finding resistance at MAs on different charts now
Towards the end of last week GBP/USD turned bearish as the likelihood of Theresa May passing her Brexit deal diminished. She lost the meaningful vote 286-344 in the British Parliament but she didn’t quit and is continuing her fight to get Brexit done, which has left markets where they were before the vote, quite uncertain.
GBP/USD lost around 150 pips after the vote but it closed the week above 1.30. Today the sentiment has improved in financial markets, as the rally in stocks shows. That’s probably due to the positive economic data from China which was released yesterday, especially the manufacturing PMI.
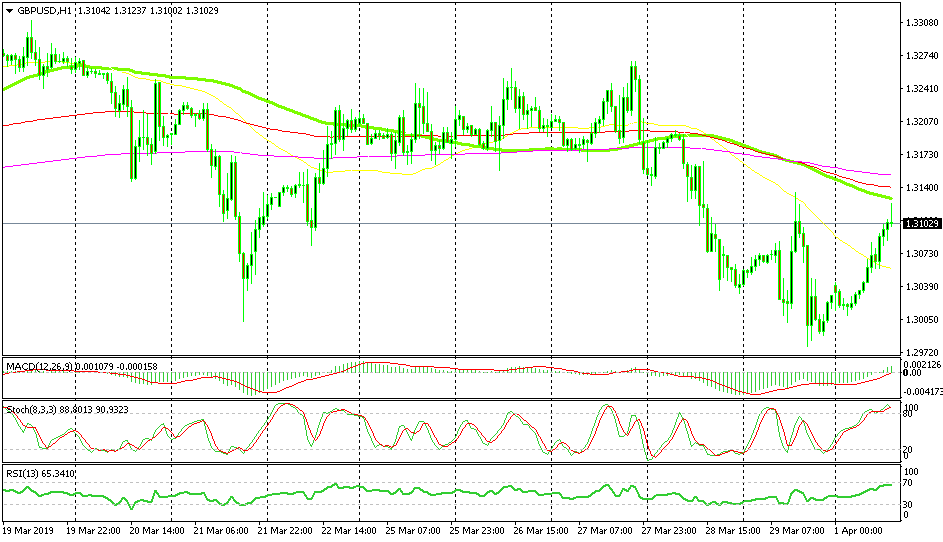
The H1 chart is overbought now
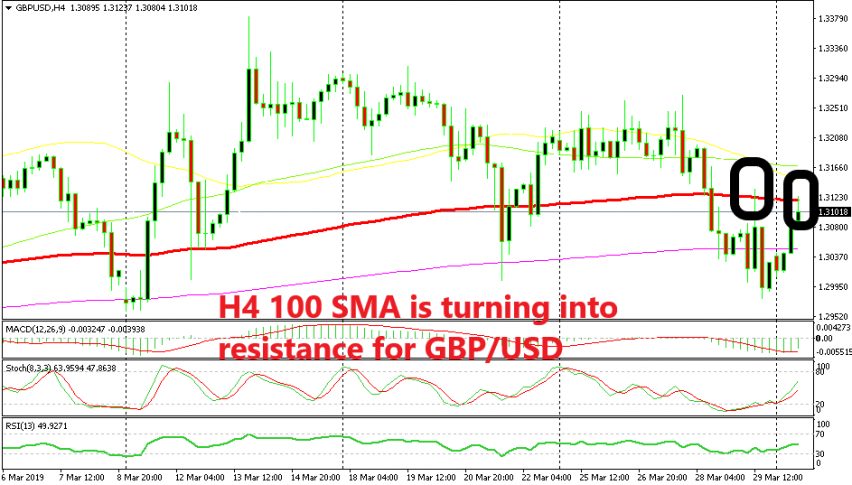
As a result, GBP/USD is nearly 100 pips higher now but it is finding resistance at moving averages on different time-frame charts. On the H1 chart, we have the 100 simple MA (green) providing resistance , while on the H4 chart the 100 smooth MA (red) is doing that job.
The H1 chart is well overbought now as stochastic shows while the H4 chart is becoming overbought. So, we might see a bearish reverse from here if the buyers fail to break above these moving averages. If they break above them, then that would open the door for 1.3250-60. Right now it is not clear which side will take the upper hand, but we’ll keep an eye on this pair in the coming sessions.
- Check out our free forex signals
- Follow the top economic events on FX Leaders economic calendar
- Trade better, discover more Forex Trading Strategies
- Open a FREE Trading Account
- Read our latest reviews on: Avatrade, Exness, HFM and XM
Related Articles


Sidebar rates
Related Posts
