WTI Crude Facing a Big Obstacle on the Daily Chart
Crude Oil has been climbing higher for more than 3 months, but it is facing a difficult indicator now.
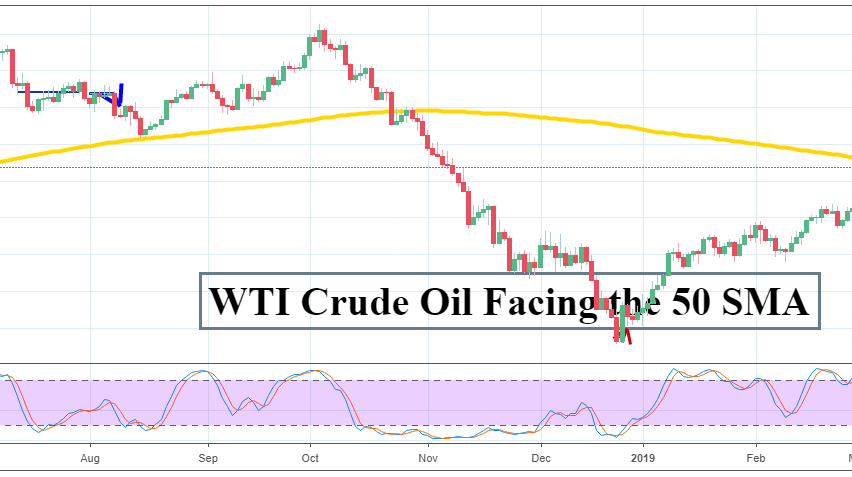
Crude Oil made a bullish reversal at the end of December right after Christmas. Since then, it has put up quite a bullish run and WTI crude has gained about $20, which means that it has gained nearly 50% of the value taking into account the bottom at around $42 back in December 26.
OPEC+ has surely helped by putting a lid on production output and, on top of that, the sanctions on Venezuela have played their part. The economic slowdown should have kept oil prices subdued and Donald Trump likes them low, but OPEC and sanctions have been winning the battles for the buyers.
But now, WTI crude Oil faces a big obstacle above. The 50 SMA (yellow) is standing just above the price on the daily chart. This moving average has provided support on pullbacks back in the middle of August and it quickly turned into resistance after it was broken at the end of October. Now there’s a possibility that it turns into resistance again with the prices on the climb.
Oil is overbought on all time-frames up to the weekly chart, so a reverse down from here is on the cards. If not a proper bearish reversal, then a decent pullback is overdue and might happen now, so we will keep an eye on the price action in the coming sessions, and hopefully we will get a signal to try the short side.
- Check out our free forex signals
- Follow the top economic events on FX Leaders economic calendar
- Trade better, discover more Forex Trading Strategies
- Open a FREE Trading Account


