GBP/USD Forming A Bearish Reversing Signal at the 100 SMA
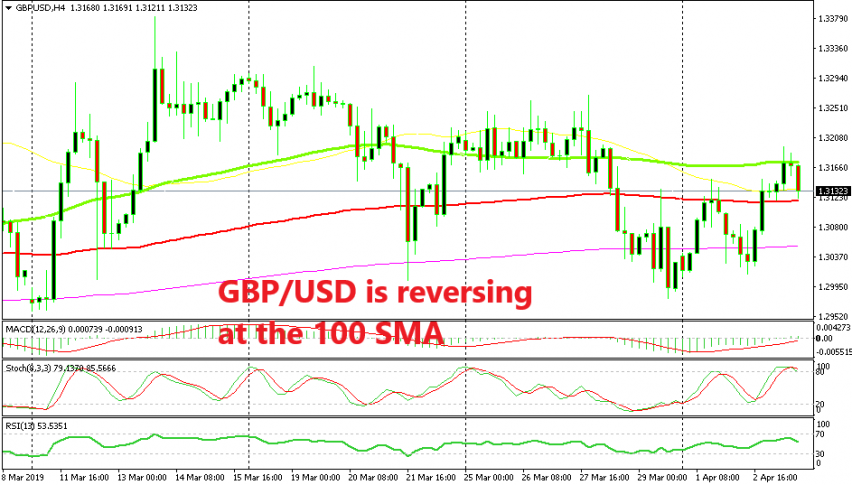
GBP/USD has found strong resistance at the 100 SMA on the H4 chart and it has formed a great bearish reversing setup
[[GBP/USD]] turned bearish last week as Theresa May lost for the third time trying to push her Brexit deal through the Parliament. This week though, this pair has been bullish, climbing narly 200 pips from the lows above 1.130. I suppose markets are getting used to Theresa May losing the meaningful vote since nothing has been changing after that.
Although, today this pair reached the 100 SMA (green) on the H4 time-frame chart. This moving average provided support during the first half of last week and it seems like it has turned into resistance now. The price pierced above this moving average a couple of time, but none of the H4 candlesticks closed above it, so it doesn’t count as a break.
In fact, it is working well as resistance as the previous candlestick closed as a doji just below it, which is a reversing signal after the bullish move earlier. The current H4 candlestick already looks pretty bearish and GBP/USD is around 40 pisp lower now, which means that the reversal has already begun. The 100 smooth MA (red) is now turning into support after working as resistance fo several days, so that’s an obstacle for sellers, but if it goes, then it will open the door lower to the 200 SMA (purple).
- Check out our free forex signals
- Follow the top economic events on FX Leaders economic calendar
- Trade better, discover more Forex Trading Strategies
- Open a FREE Trading Account


