Will WTI Crude Oil Turn Bearish Here at the 50 SMA?
WTI crude Oil has reached the 50 SMA on weekly chart and it is finding resistance already
Crude Oil prices made a reversal at the end of December last year after having traded in a steep bearish trend for three months, losing more than 1/3rd of its value. OPEC+ decided to cut production at the end of last year, which seemed to be the only thing stopping Oil prices from falling further.
So, the bullish reversal came after that and WTI Crude Oil climbed more than $20 in the last three and a half months. The climb has not been that steep but it has been consistent nonetheless, with shallow pullbacks. But now the bullish move has run its course and it seems a bit exhausted.
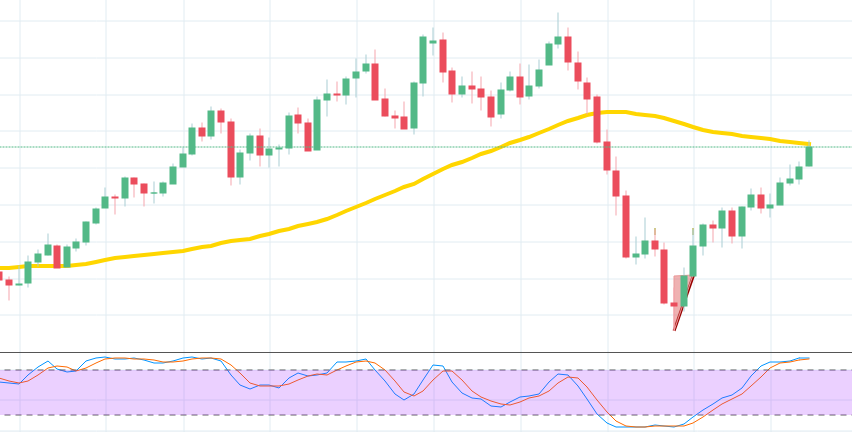
The weekly chart is overbought as the stochastic indicator shows. Besides that, the price has reached the 50 SMA (yellow). WTI Crude Oil reached this moving average yesterday, which stands at $62.75 and retreated back down after that. That is a sign that this moving average is under attention.
We will follow the price action and see how Oil behaves around here. If it forms a reversing indicator such as a doji/pin candlestick then we might even open a long term sell signal, hoping for a decent pullback lower at least.
- Check out our free forex signals
- Follow the top economic events on FX Leaders economic calendar
- Trade better, discover more Forex Trading Strategies
- Open a FREE Trading Account


