EUR/USD Keeps Being Pushed Down by Moving Averages
EUR/USD has been bearish for more than 2 weeks and moving averages have helped push it lower
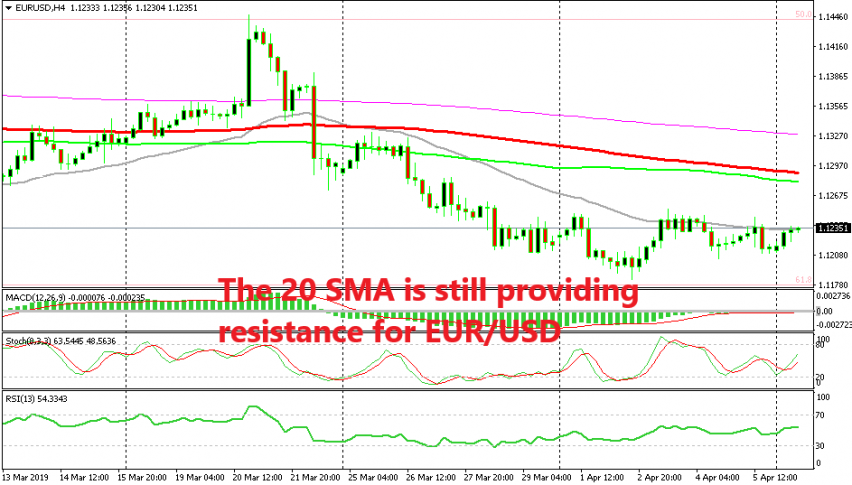
[[EUR/USD]] has been trading in a bearish trend for more than two weeks now, when it reversed at 1.1450 following a 100 pip jump higher. Since then, the pressure has been on the downside and this pair has lost around 270 pips. But, we see that the downtrend has slowed down.
As you can see from the H4 time-frame chart above, the decline was pretty fast in the first week when the bearish reversal took place, losing around 170 pips from top to bottom. But in the next week, the downtrend slowed. Last week, the downtrend slowed further but the trend remained bearish as EUR/USD made new lows. The 20 SMA (grey) provided solid resistance last week and it is doing so again this morning.
EUR/USD is facing the 100 SMA again on the H1 chart
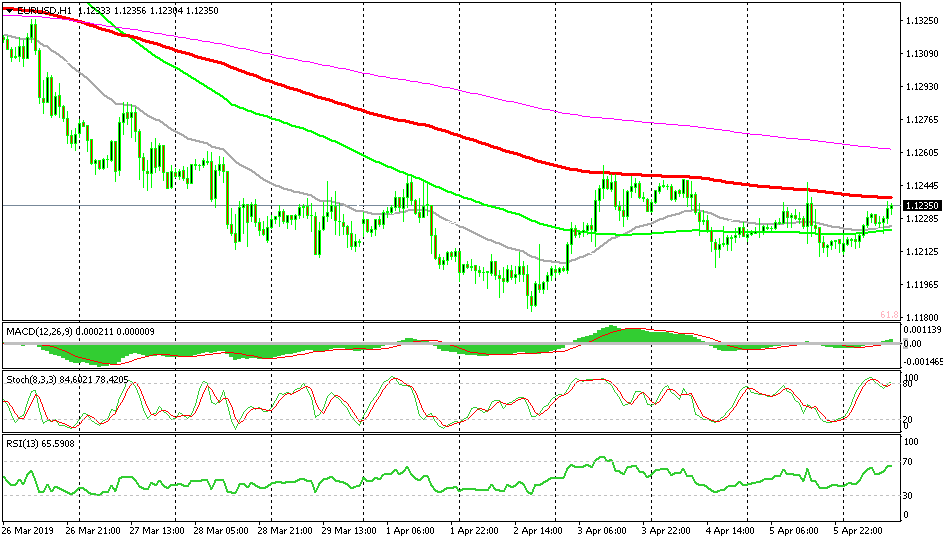
Switching to the H1 time-frame, we see that the 20 SMA was providing resistance to this pair two weeks ago when the bearish trend was quite steep, but then the 100 SMAs took its place as the trend slowed. Last week we saw the 100 SMA (red) provide resistance and pushing the highs lower. On Friday last week, the high was at 1.1246 where the 100 SMA reversed the price back down. Right now, the price is close to the 100 SMA again.
This might be a good place to open another sell signal apart form the long term trade we already have on. But, only if the 100 SMA holds, which means that the downtrend will still be in place. Otherwise, if the 100 SMA breaks, then that would be a sign that the downtrend might be over and a deeper pullback higher will be on the cards.
- Check out our free forex signals
- Follow the top economic events on FX Leaders economic calendar
- Trade better, discover more Forex Trading Strategies
- Open a FREE Trading Account


