Buying the Pullback in USD/JPY at the 50 SMA
USD/JPY has been retracing lower this week but the pullback seems complete, hence our buy signal a while ago
[[USD/JPY]] has been trading in a bullish trend sine the beginning of the year after reversing, following a 5 cent dive in thin markets after New Year’s day. Since then, the uptrend has been consistent, although we saw a pullback lower in March. But towards the end of that month, the uptrend resumed again after the refresh lower and USD/JPY is back to being bullish.
This week though, we are seeing another retrace lower, albeit pretty slow and shallow, which means that the pressure is still on the upside. Safe haven assets have attracted some bids in the last two days and Gold has climbed while USD/JPY has slipped lower. The retrace seems to be over now on the H4 time-frame, so we decided to go long a while ago.
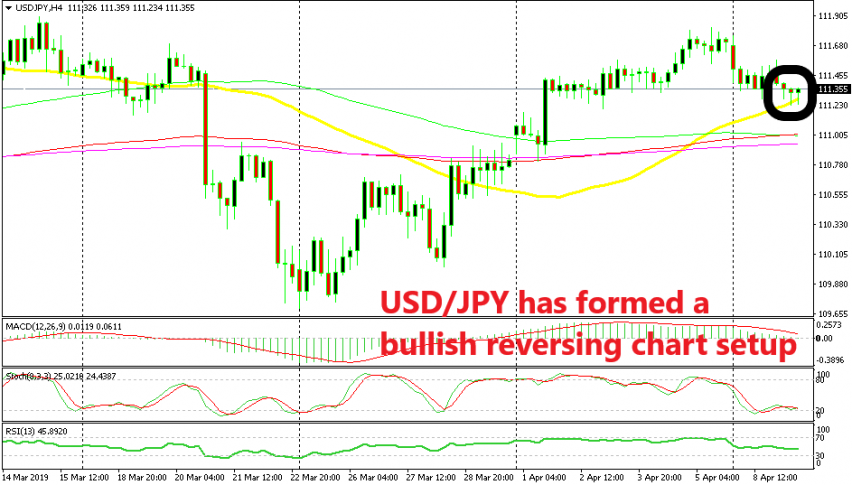
The stochastic indicator is oversold now which means that the retrace is complete. The price found support at the 50 SMA (yellow) on the H4 chart and besides that, the previous candlestick closed as a hammer. That’s a bullish reversing signal after the bearish retrace. This looks like a reversing chart setup, so we went long. Now we wait for the reverse to take place, which is already happening as the current candlestick looks sort of bullish.
- Check out our free forex signals
- Follow the top economic events on FX Leaders economic calendar
- Trade better, discover more Forex Trading Strategies
- Open a FREE Trading Account


