The Resistance at $5,300 Holds for the Third Time in Bitcoin
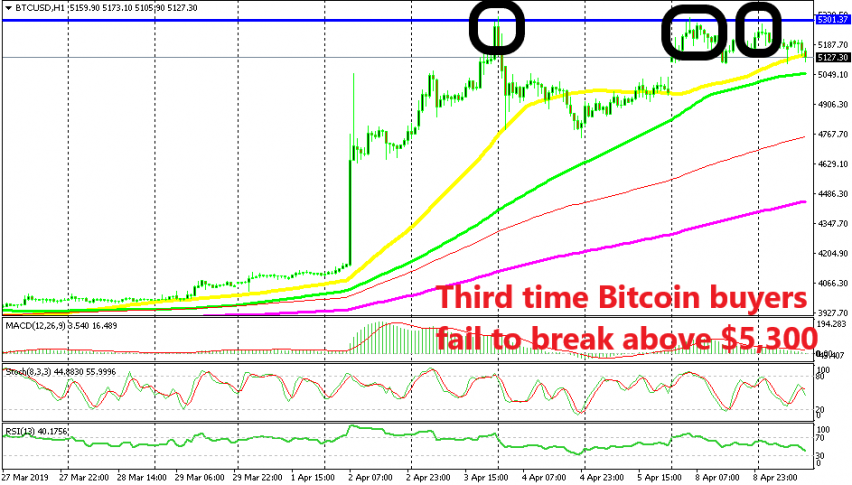
Bitcoin buyers had another try at $5,300 which has now formed a solid resistance, but failed to break above it for the third time

BITCOIN made a strong bullish move last week. Looking at larger time-frame charts, that move is not extraordinary, but we have gotten used to low volatility in recent months in cryptocurrencies, especially to the upside; that’s why it has attracted the interest from traders. Traders who are long since the big surge last year are eyeing every bullish move since they are down on their trades and I know quite a few of them.
Bitcoin broke above the $5,000 level last week, but it has formed a resistance zone at the $5,300 level. This was the high last week and the buyers tried that level again yesterday and today, but without much success. The price reversed down from there, which suggests that this is the level for the buyers to take out if the recent uptrend is going to continue. This is the third failure, so perhaps they will give up soon if they get exhausted.
At the moment, the sellers are in charge as they are pushing lower, but they are facing the 50 SMA (yellow) now on the H1 chart. If this moving average gets broken as it did last week, then comes the 100 simple MA (green). This will be the battle between buyers and sellers now. If buyers push above $5,300, then the bullish momentum is bound to continue at least until the $6,000 level, which used to be solid support on the way down. If sellers push below the top 2 moving averages, then it will open the door for $4,000-4,200.
- Check out our free forex signals
- Follow the top economic events on FX Leaders economic calendar
- Trade better, discover more Forex Trading Strategies
- Open a FREE Trading Account


