Dax Finds Support at Moving Averages on Daily and H4 Charts and Bounces
Dax retraced lower earlier this week but moving averages held the decline and te price bounced off of them
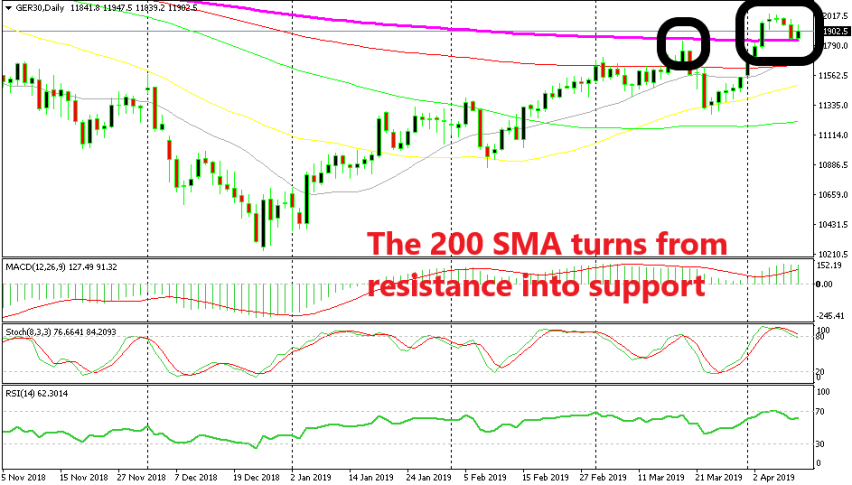
The main German index DAX has been on an uptrend since late in December as the sentiment in financial markets started to improve. We saw a pullback at the beginning of February and the end of March, as you can see from the chart above. Last month, Dax found resistance at the 200 SMA (purple) on the daily time-frame and retraced lower for several days, but the 50 SMA (yellow) held as support for the second time, after the pullback in February.
The price formed a few doji/hammer daily candlesticks above that moving average, which are reversing signals, and bounced back up. We went long on that occasion and got some nice profit. The price finally broke above the 200 SMA early this month but reversed again after forming two daily doji candlesticks. You see that dojis are great reversing signals?
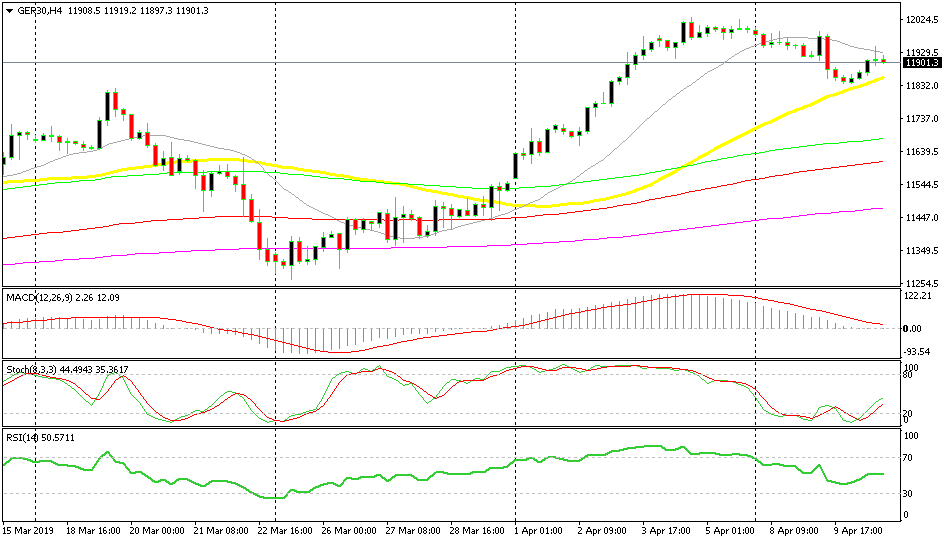
On the H4 chart, Dax found support at the 50 SMA at the end of last month. Trump’s tweet about tariffs on European goods also helped sending stock markets lower earlier this week, but we saw the price jump yesterday.
So, the moving averages held this time in both the H4 and daily charts. Although the 20 SMA (grey) provided resistance on the H4 chart yesterday after the ECB press conference and the mixed US inflation. We’ll see if the bounce will take us higher or whether there will be a deeper pullback lower.
- Check out our free forex signals
- Follow the top economic events on FX Leaders economic calendar
- Trade better, discover more Forex Trading Strategies
- Open a FREE Trading Account


