The Pullback for NZD/USD Seems to be Over
NZD/USD was sort of bullish last week, but it seems that the bullish move is over now

Risk assets finally turned positive last week as the sentiment improved in financial markets. Stock markets turned bullish during the second half of the week while commodity Dollars were slightly bullish all week. NZD/USD was climbing higher slowly during the first half of the week, but made a sharp reversal lower on Thursday.
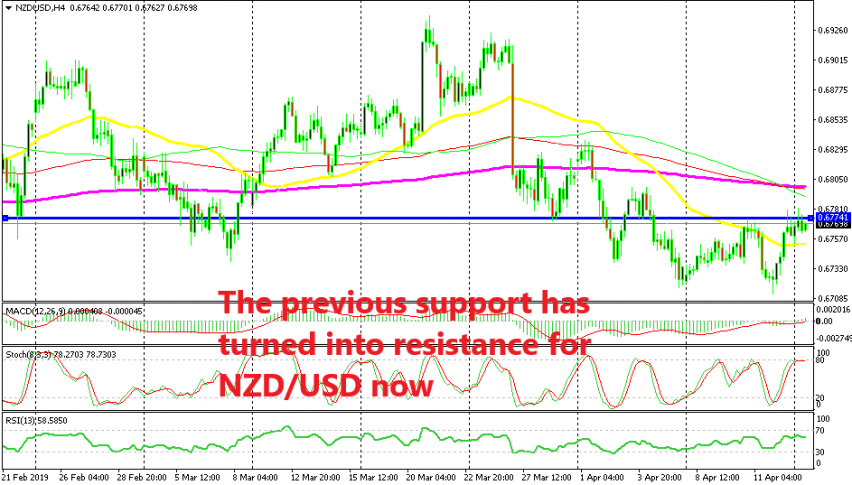
Although, on Friday the price made a swift reversal higher once again and pushed around 70 pips higher. But, from the H4 chart above we see that the buyers had trouble taking out the previous support area around 0.6775 which seems to have turned into resistance now. In fact, the stochastic indicator is overbought on this time-frame now and it looks like NZD/USD is reversing back down, which means that the support is really turning into resistance.

The price here is stuck between the 200 SMA at the top and the 100 SMA at the bottom
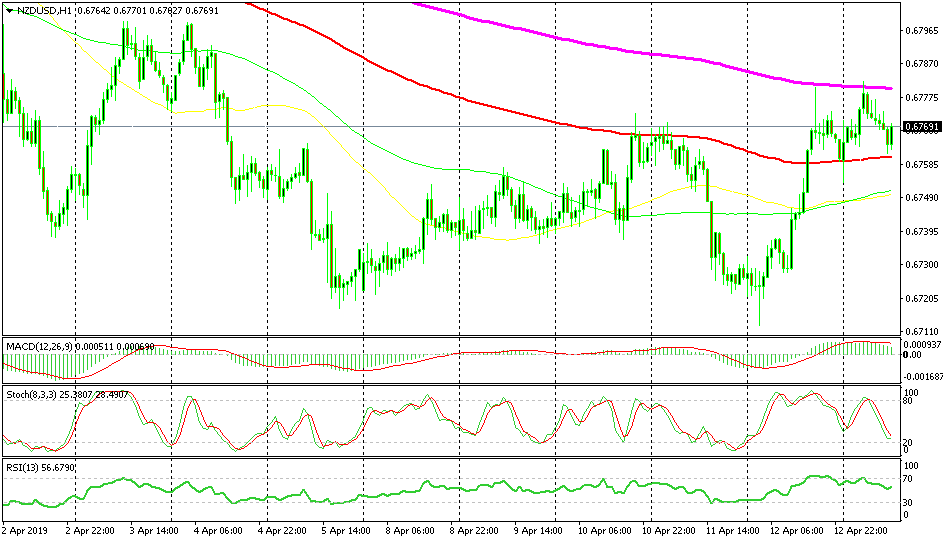
If we switch to the H1 chart, we see that the buyers found solid resistance at the 200 SMA (purple). They failed at this moving average on Friday and again this morning. The price is slipping lower now but on this time-frame we have the 100 SMA (red) which is holding the decline. It provided support this morning when markets opened and the sellers are facing it again now.
So, here we have the 100 SMA which has turned from resistance into support. But, the H4 chart still points down and I think that the higher time-frame will have a bigger say for this pair, which means that NZD/USD is bound to continue lower and break the 100 SMA on the H1 chart.
- Check out our free forex signals
- Follow the top economic events on FX Leaders economic calendar
- Trade better, discover more Forex Trading Strategies
- Open a FREE Trading Account


