USD/CAD Bounced Off the 200 SMA But Now Stuck in a Tight Range
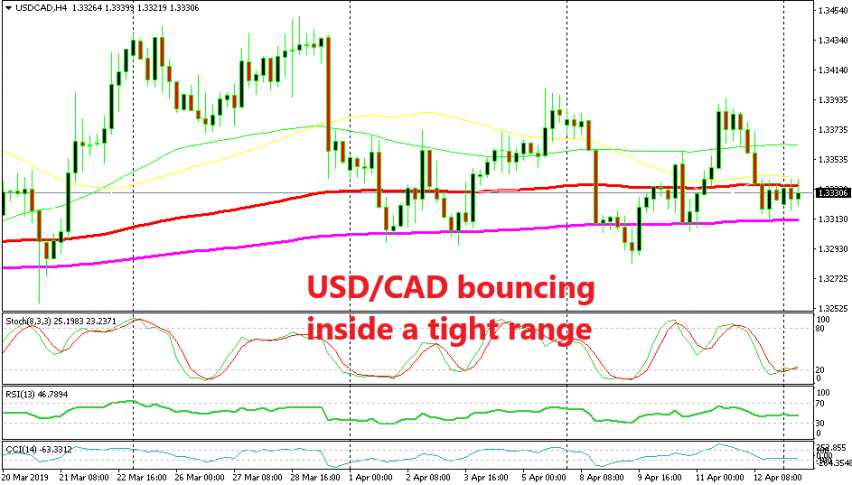
Last Friday we decided to go long on USD/CAD when the USD was under some pressure. But, Crude Oil was reversing lower from the resistance, which was a sign that the CAD wouldn’t benefit from the USD weakness as much as other risk currencies. So, we decided to open a buy signal at the 200 SMA (purple) on the H4 chart.
As you can see, this moving average has been providing solid support during the last two weeks. The price has pierced the 200 SMA several times but it has returned back above it, so this moving average is a good indicator to go long from and that’s what we did.
The price did bounce 25 pips higher that day to 1.3340 and the buyers are still trying to push above this level today. But, we can see that the 100 SMA (red) is providing resistance up there. The buyers are having some trouble trying to break this moving average, so USD/CAD seems stuck between these 2 MAs now.
The pressure is slightly to the upside but unless the 100 SMA gives way, it’s going to be a tough battle between buyers and sellers. Although, Crude Oil has been crawling higher in the last two sessions but the CAD is not following it higher (USD/CAD lower) which is a good sign for us, so let’s hope that the 100 SMA breaks soon.


