WTI Crude Finding Resistance at the 50 SMA After Sliding Below it
WTI crude Oil has found some solid resistance at $64.50 and has now slipped below the 50 SMA on the H4 chart
Crude Oil has been trading on a bullish trend for nearly 4 months now since it made a decisive reversal at the end of December, after tumbling down in the previous 3 months and losing 1/3rd of its value. The uptrend hasn’t been as fast as the decline that we saw from October to December, but it has been consistent nonetheless.
Last week the buyers pushed US WTI Crude Oil to $64.60s but they couldn’t make any new highs or at least reach the $65 level. They tried three times at the top but failed each time, which tells us that a strong resistance area has formed up there at around $64.50-60. Eventually, the price reversed back down yesterday after failing to make new highs after the third attempt, so third time’s a charm, right?
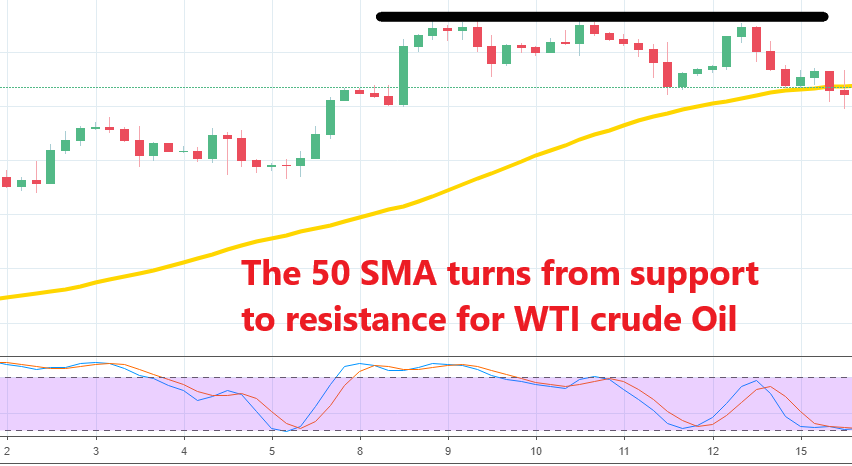
The price found support at the 50 SMA (yellow) in the H4 chart for some time, but the sellers managed to push a little lower and the 50 SMA moved above the price. Now, it seems like this moving average has turned into resistance for WTI crude. It stands at $63.50 and it is decisive for Oil now; above it and WTI crude remains bullish, below the 50 SMA and Oil turns bearish, at least until $60 first, so we should watch the price action around here.
- Check out our free forex signals
- Follow the top economic events on FX Leaders economic calendar
- Trade better, discover more Forex Trading Strategies
- Open a FREE Trading Account


