Gold Finally breaks the Support Levels and the 100 SMA
Gold has revered to bearish now and yesterday we saw a break of the first support level
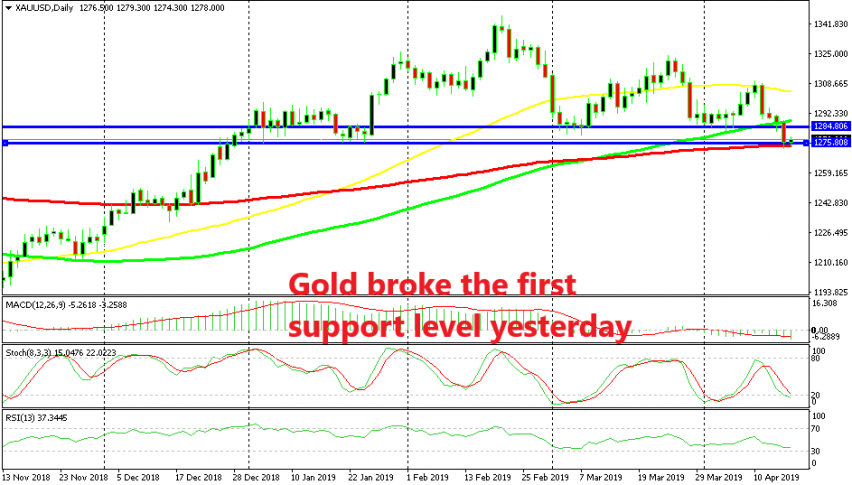
GOLD started to turn bearish in the middle of February right after it formed an upside-down hammer candlestick on the daily chart, as you can see above. The uptrend which started at the end of summer last year is now over and the sellers are gaining more confidence as buyers fail to take control.
We have seen buyers attempt to reverse the momentum in their favour a few times, but the bullish moves higher have ended up making lower highs each time. This is a clear sign that the trend has changed, otherwise it would make higher highs. But, the support at $1,285 and $1,275 have stopped the sellers from pushing lower.
The 100 simple MA (green) also joined to provide support during the last attempt at the beginning of this month. But, the 50 SMA (yellow) turned into resistance this month. the price reversed back down from there and yesterday Gold broke the first support level at $1,285 and the 100 simple MA. But now we are facing the 100 smooth MA (red) on the daily chart and the second support level. Sellers will have to break this moving average for the downtrend to continue. However, a retrace to the 100 simple MA (green) would be a good place to look for shorts now.
- Check out our free forex signals
- Follow the top economic events on FX Leaders economic calendar
- Trade better, discover more Forex Trading Strategies
- Open a FREE Trading Account


