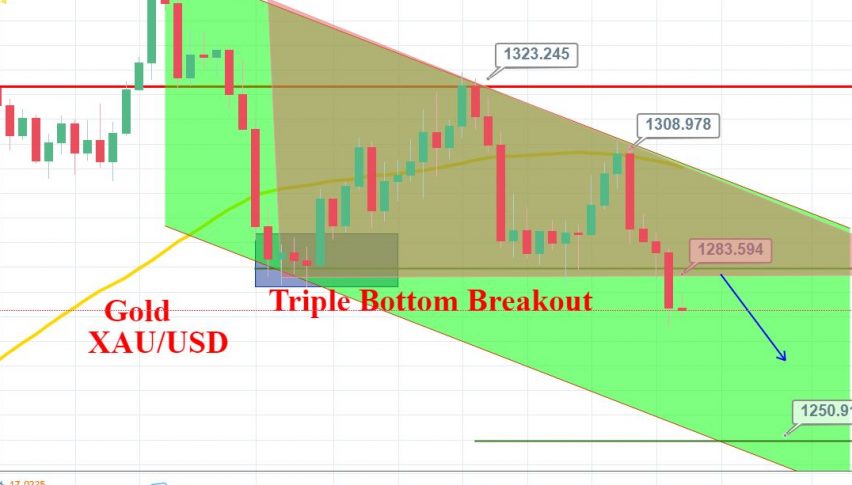
Gold Slips Below $1,285 – is it Going After $1,250?


On Wednesday, the yellow metal GOLD steadied around a 4-month trough, after falling below triple bottom support area of 1,283. One of the reasons behind this sell-off is an o a surge in global equities, while a stronger dollar piled pressure on the metal.
On the technical side, gold has violated the descending triangle pattern at 1,284.
On the daily timeframe, we can see candlestick of three black crows which signify a robust bearish bias of traders.
The closing of daily candle below 1,284 also adds to the bearish bias of traders.
What’s Next?
Well, we opened a forex trading signal in gold to capture a bullish retracement. The buying position was opened above 1,275 with a target of 1,280. Unfortunately, the market has reversed after placing a high of 1,279.82.
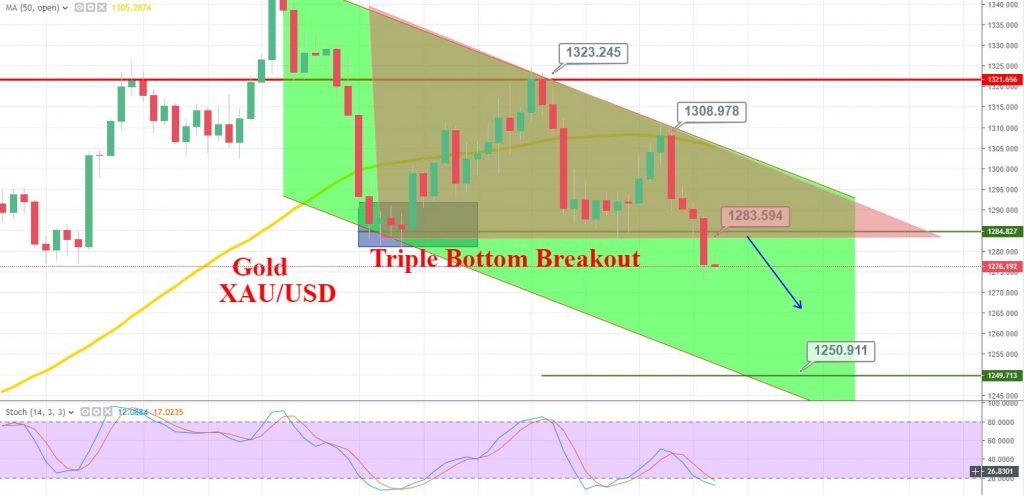
Support Resistance
1270.65 1285.11
1264.6 1293.52
1250.14 1307.98
Key Trading Level: 1279.06
So, the idea is to stay bearish until 1,283 and take profit of around 1,260. Overall, the bearish trend seems pretty strong, and especially the violation of a descending triangle pattern can lead GOLD prices towards 1,250 in coming days.
Good luck and trade with care!