Gold’s Descending Triangle Breakout Led to Decline
Gold prices are on course for a fourth straight weekly decline, as recent economic data drove investors towards riskier assets....
GOLD prices are on course for a fourth straight weekly decline, as recent economic data drove investors towards riskier assets, where the economic data from the Chinese economy plays a major role. The optimistic Chinese data implies that the worries over a slowdown in global economic growth have been mitigated. Consequently, it elevates risk appetite, in turn pressuring gold.
China’s economy expanded in the first quarter remained steady at 6.4%, topping the forecast for a 6.3% growth. The data boosted global appeal for riskier assets and pushed overall gains in stock markets.
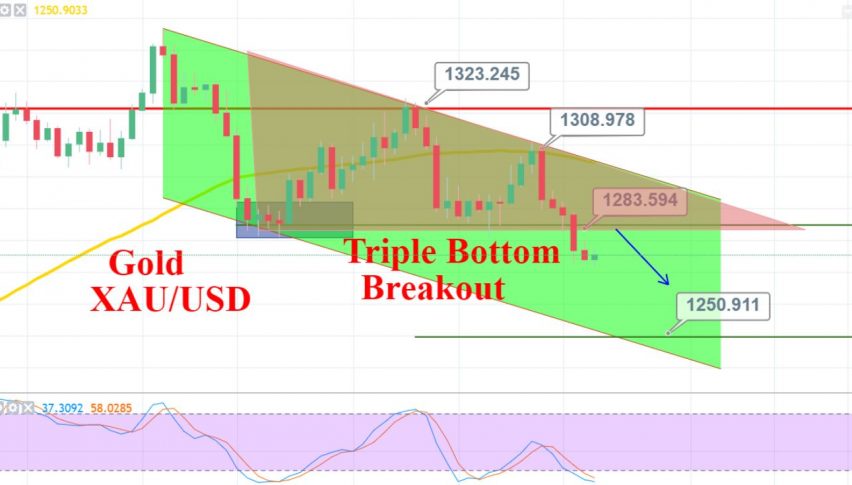
On the technical side, gold has violated the descending triangle pattern at 1,284. The closing of daily candle below 1,284 is adding to the bearish bias of traders. We may see further sell-off below this level.
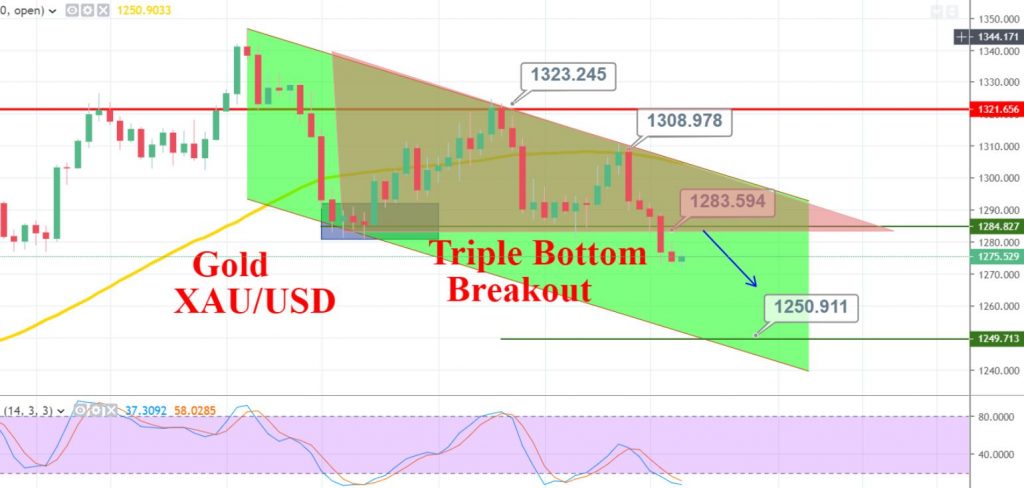
Gold can find support around 1,271 and 1,265. While as per descending triangle breakout, the precious metal can also lead towards 1,250 this week.
Support Resistance
1271.37 1278.13
1268.86 1282.38
1262.1 1289.14
Key Trading Level: 1275.62
So, the idea is to stay bearish below 1,280 with a take profit of around 1,270 and 1,265.
Good luck and trade with care!
- Check out our free forex signals
- Follow the top economic events on FX Leaders economic calendar
- Trade better, discover more Forex Trading Strategies
- Open a FREE Trading Account
- Read our latest reviews on: Avatrade, Exness, HFM and XM
Related Articles


Sidebar rates
Related Posts
Ava

