EUR/USD Resumes the Long Term Downtrend but Needs to Break Support at 61.8% Fibo Level


EUR/USD turned bearish on the long term charts at the beginning of last year after having been on a bullish trend during the entire 2017 and in the first few months of 2018. The reverse took place at 1.2450s and since then, the traffic has been one way only. This pair has lost around 23 cents for a bit more than a year and retraces higher have been pretty shallow.
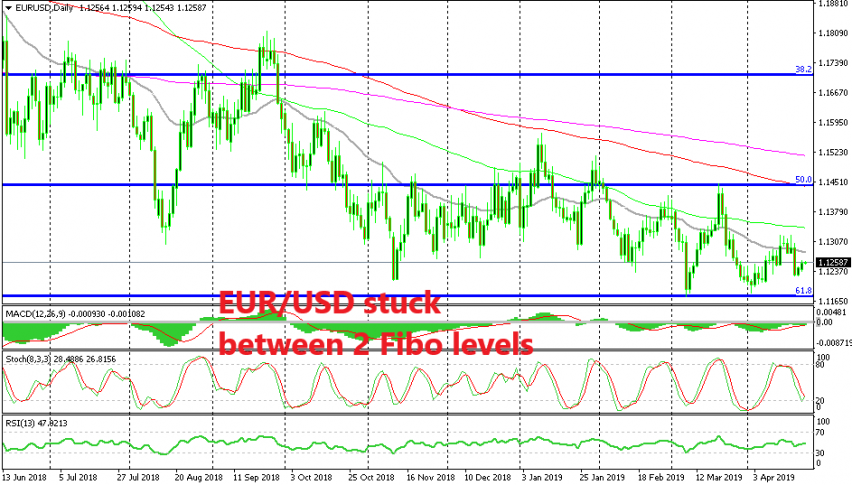
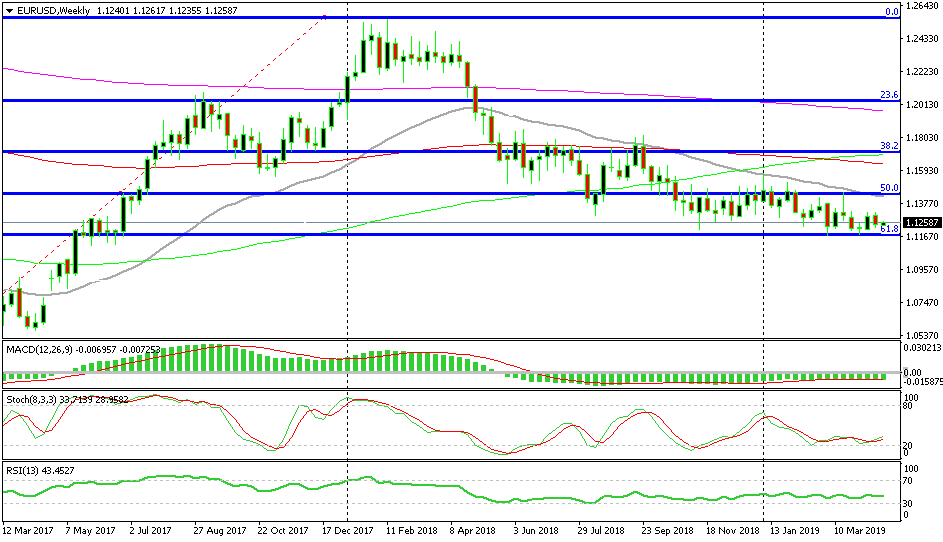
Although, since August the pace of the decline has slowed considerably and the sellers are having trouble making new lows. The low print on August was 1.13 exactly to the pip and the low since then stands at 1.1176, which was put in place last month. That was the 50% Fibonacci level which was drown from the bottom at 1.0340 in 2016/2017 to the top at 1.2550s in 2018.
EUR/USD seems to has formed a bottom at 1.1176 because the sellers had another try at that level but they gave up and the price reversed just above that support level. On the other side, the bullish move last month ended at the 50% Fibo level, so the price is bouncing between these two Fibonacci levels. It looks like a range has formed which stretches between 1.1450 and 1.1180, more or less.
The last reverse this month took place last week after the retrace higher. The price formed a doji candlestick on the daily time-frame, which is a reversing signal and the price reversed. Stochastic was also overbought which was another indicator that the bullish move was complete and the confirmation that the manufacturing sector is deep in contraction in the Eurozone was the final catalyst to push EUR/USD down.
The 20 SMA has been pushing EUR/USD lower since last August
In the weekly time-frame, EUR/USD has been finding resistance at he 20 SMA (grey) which has defined the downtrend since late last year. This moving average gave EUR/USD the last push in March when the price failed to break above it. So, the downtrend is sill in place for this pair, but for now the price is stuck between the 2 Fibo levels. When the 61.8% level goes, then the downtrend will pick up pace again.