US WTI Crude Finding Support at the 50 Hourly SMA
Crude Oil has retraced lower after making new highs yesterday, but the 50 hourly SMA held the decline and reversed the price

Crude Oil has been having quite a bullish run so far this year after it made a reversal at the end of December. US WTI crude has gained around $24 from the bottom at $42.50 late last year to $66.50s which was the high yesterday. Oil prices made a 100 pip jump yesterday after the comments from US officials over the weekend for full sanctions on Iran’s Oil. Less supply means means increased demand and therefore higher prices.
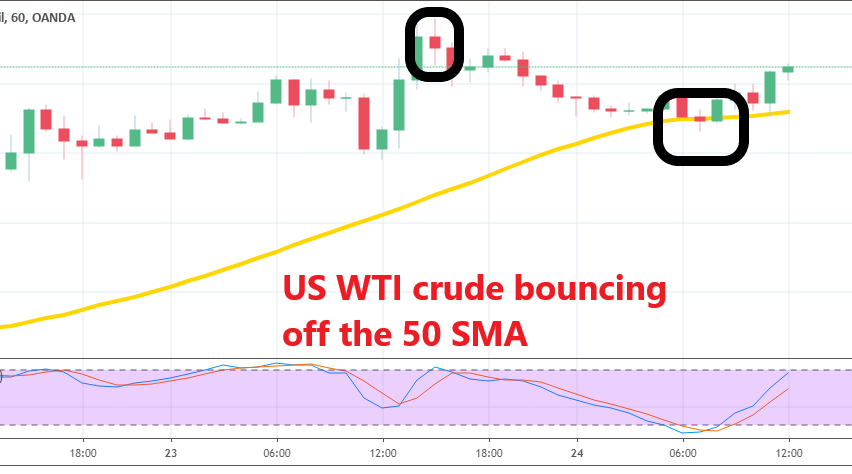
WTI crude formed a morning star candlestick on the H1 chart which is a reversing signal, similar to dojis and pins. Since then, Crude Oil has been sliding lower in what seems to be a retrace before the next bullish move. The price declined to $65.70s earlier today but it seems that the 50 SMA turned into support for US Oil on the H1 time-frame char.
The 50 SMA was pierced briefly but no candlestick closed below it, so there was no break. The price formed a doji right at the the 50 SMA which is a bullish reversing signal in this case, after the decline in the last two sessions. The stochastic indicator was also oversold on this time-frame, which means that the pullback is complete. Now, Crude Oil has bounced off the 50 SMA, so the support at the 50 SMA is confirmed now.
- Check out our free forex signals
- Follow the top economic events on FX Leaders economic calendar
- Trade better, discover more Forex Trading Strategies
- Open a FREE Trading Account


