Bitcoin Tries to Turn Down, but the 200 Daily SMA Keeps It Bullish
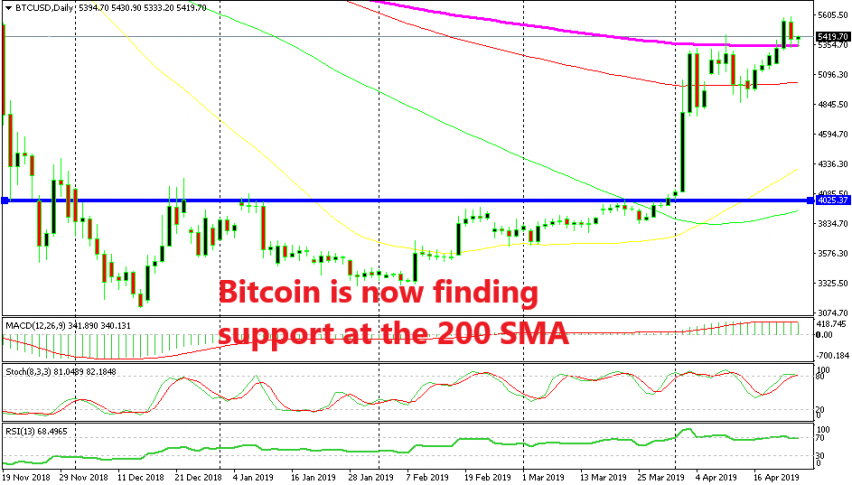
Bitcoin was finding resistance at the 200 SMA for two weeks. But after the break, the 200 SMA turned into support

BITCOIN has had a great month so far in April. It first broke the resistance level at $4,000 which had been keeping Bitcoin subdued for several months and then it surged more than $1,000 pips higher. But, the 200 SMA (purple) on the daily chart has now turned into resistance.
Buyers had a tough time trying to break above this moving average and for a couple of weeks, Bitcoin traded in a range between the 200 SMA at the top and the 100 SMA (red) at the bottom, roughly speaking. There have been piercings to the upside and the downside during that time, but the price got stuck in this range.
But, this week the break finally came and it happened to the upside as buyers finally pushed above the 200 SMA. The price got pretty close to $5,600 on my platform, but that was enough for them and they let go for now. The sellers have tried to get back in the game in the last two days, pushing to $5,300s.
But the 200 SMA seems to have turned from resistance into support now, as is usually the case with large technical indicators. This might be a good place to go long from, with a target below $6,000 and a stop below $5,300, but that’s if Bitcoin remains bullish. So, for those who think that Bitcoin will remain bullish, this is the trade for now.
- Check out our free forex signals
- Follow the top economic events on FX Leaders economic calendar
- Trade better, discover more Forex Trading Strategies
- Open a FREE Trading Account


