EUR/CHF Finds Support at the 100 SMA After the 2-Day Pullback
EUR/CHF retraced lower off the highs below 1.15 this week, but the retrace might be over now as EUR/CHF bounces off the 100 SMA

EUR/CHF made quite a reversal at the start of this month. The last two weeks of March were pretty bearish for this pair as it lost more than 200 pips among deteriorating market sentiment, after the deep contraction in the Eurozone manufacturing activity. But, the Swiss National Bank Chairman Thomas Jordan threatened with intervention if the CHF kept appreciating and the reversal took place soon after that.
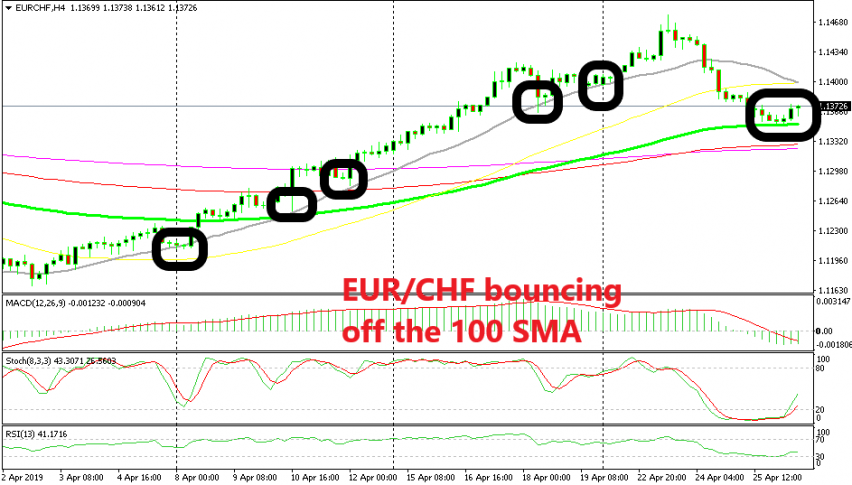
Since then, the pressure has been on the upside and the uptrend has been really strong, as shown by the 20 SMA (grey) which has been providing solid support for almost a month. The smaller the moving average in play, the stronger the trend, since the buyers haven’t waited for larger period MAs to catch up.
But the price formed an upside-down pin candlestick on the H4 time-frame chart on Tuesday which is a reversing signal and the last two days have been pretty bearish for this pair. It has lost 125 pips during this decline, finally breaking the 20 SMA and the 50 SMA (yellow).
But now we see this pair is finding support at the 100 SMA (green). It formed two small doji candlesticks right above this moving average and it is bouncing higher now. Although, the question which arises now is whether the uptrend is over and a trend reversal is underway, or if this is just a pullback before the bullish trend resumes.
Right now, the price is bouncing which is a good opportunity for buyers, but at the same time, the area below 1.15 has been providing resistance to this pair since August last year and the climb this month has stretched a bit far for the buyers. So, if you bought the pullback at the 100 SMA, you better consider closing at the 20 and 50 SMAs at 1.14. Or, if the buyers push above these indicators, then this week’s high should be enough for those who are long because they will have a tough time below 1.15.
- Check out our free forex signals
- Follow the top economic events on FX Leaders economic calendar
- Trade better, discover more Forex Trading Strategies
- Open a FREE Trading Account


