NZD/USD has Formed a Strong Bearish Reversing Setup on the Monthly Chart
NZD/USD has retraced higher in the last several months, but the retrace seems complete now and a bearish setup has formed on the monthly
[[NZD/USD]] as well as AUD/USD turned bearish at the beginning of last year when the USD started to turn bullish. The price action has been pretty bearish during most of the year, but towards the end of 2018 they attracted some bids as the sentiment in financial markets improved due to China-US trade negotiations.
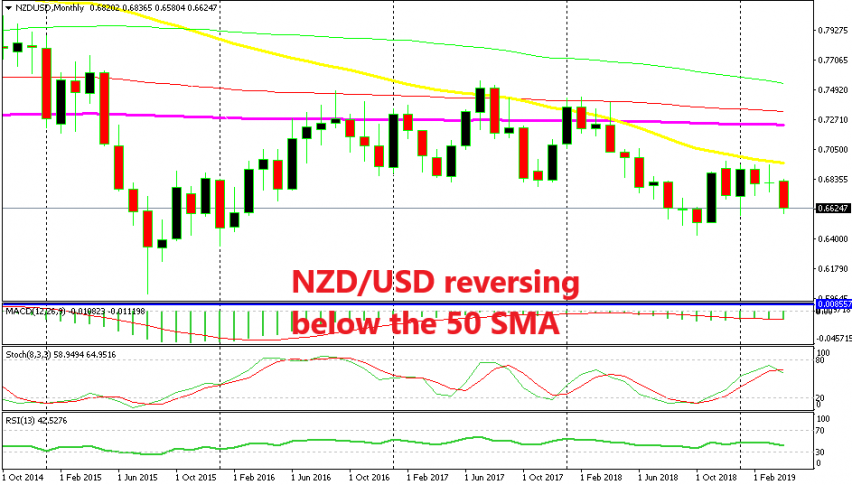
As a result, we saw a retrace during the last several months, but the retrace still looked weak on the monthly chart because the bullish months were followed by bearish ones, and we never saw two monthly bullish candlesticks in a row. The price got pretty close to the 50 SMA (yellow) on this time-frame and it seems now that the buyers just gave up close to that moving average.
The 50 SMA has also been providing resistance twice last year despite being pierced to the upside. Eventually the price reversed back down and the downtrend continued. This looks like another of those cases, but now the reversal started before the price reached the 50 SMA.
Last month’s candlestick closed as a doji, which is a reversing signal, after the retrace higher, while this month’s candlestick looks pretty bearish, so the bearish reversal is already underway for this pair. Fundamentals have also turned bearish as the inflation report from New Zealand showed, so the Reserve Bank of New Zealand might even cut interest rates now. So, the big picture seems pretty bearish for the Kiwi.
- Check out our free forex signals
- Follow the top economic events on FX Leaders economic calendar
- Trade better, discover more Forex Trading Strategies
- Open a FREE Trading Account
- Read our latest reviews on: Avatrade, Exness, HFM and XM
Related Articles


Sidebar rates
Related Posts
