2 Signs that This Year’s Uptrend in Crude Oil Might Have Come to An End
Crude oil has been on a solid uptrend for 4 months. But the signs are telling us that the trend might be over soon

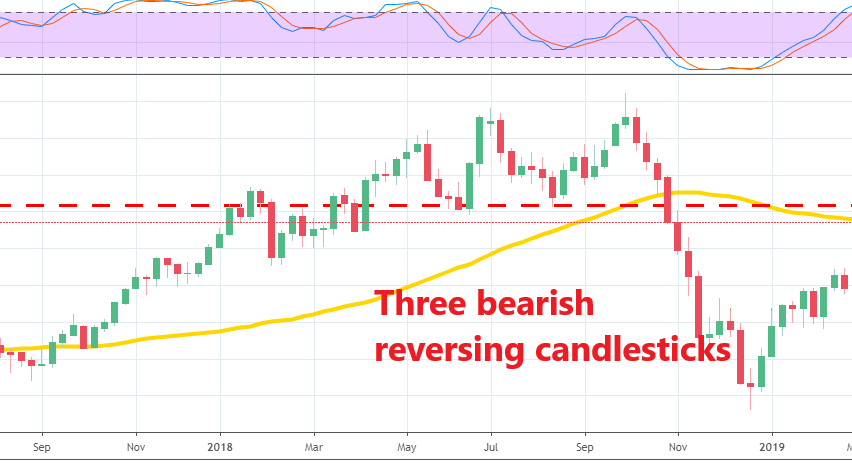
Crude Oil has been trading on a bullish trend since the end of December last year. The uptrend has been consistent and WTI Crude Oil has gained $24 from the bottom in December 24-26 to the top at the middle of last week. The price even pushed above the 50 SMA (yellow) on the weekly time-frame chart, as you can see above.
The uptrend has been consistent and many sellers have been getting burnt trying to pick a top during this climb. But we must now look seriously for a top because it seems like the trend might reverse soon. We had two strong signals this week, one technical and another fundamental, which point to a bearish reversal.
Technical
- The buyers have been finding it hard to make new highs in recent weeks, which is a sign that they might be getting exhausted now after pushing higher for four months.
- The stochastic is also overbought, which means that the uptrend is stretched too far and a refresh lower is overdue.
- Besides that, the last three candlesticks are reversing signals; in the previous two weeks we see two doji candlesticks, while last week’s candlestick closed as an upside-down hammer.
Fundamental
The US is pushing for full sanctions on Iran, as we heard US officials say early last week. The first reaction in Crude Oil was strange because it didn’t react to this news. It did jump $3 higher on Tuesday, but it reversed even quicker in the second half of the week and eventually closed $4 lower. More sanctions should be bullish for Oil since it means less supply. But Oil closed the week lower, which is not a good sign.
However, the price is still above the 50 SMA which has worked as support and resistance before, but only after the price broke it briefly. This was another break to the upside this week, but is seems that the price is reversing back down. If we move below the 50 SMA now, then it will be a sign that the sellers are finally in control, for us to go short.
- Check out our free forex signals
- Follow the top economic events on FX Leaders economic calendar
- Trade better, discover more Forex Trading Strategies
- Open a FREE Trading Account


