Bitcoin Bullish Channel – Is It Poised to Break Lower?
During the previous week, there was a sharp drop in the prices of bitcoin as the market fell below the $5,200 support against the US Dollar.
During the previous week, there was a sharp drop in the prices of Bitcoin as the market fell below the $5,200 support against the US Dollar. The BTC/USD pair spiked beneath the $5,000 support level and placed a low swing right above $4,900.
Later, the price began a gradual and steady recovery over the $5,000 and $5,050 resistance levels.
The buyers even drove the price beyond the $5,100 resistance and the 23.6% Fib retracement level of the last slide from the $5,509 high to $4,905 low.
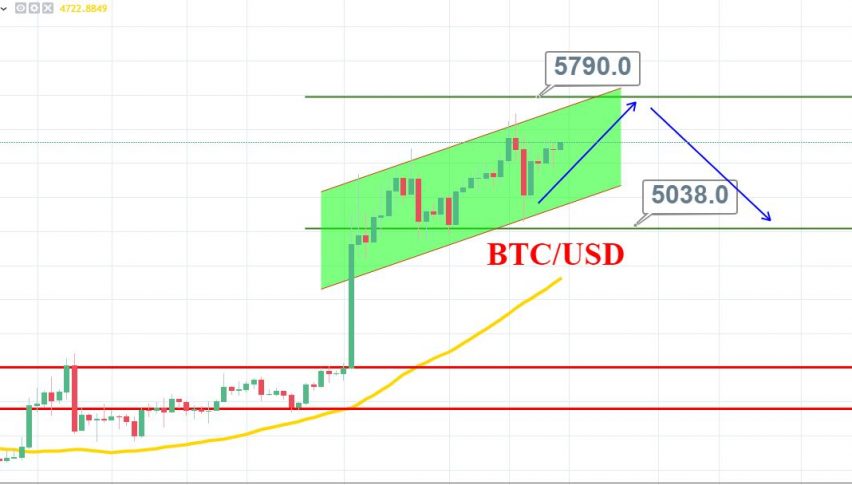
In the preceding three sessions, BTC/USD has been trading in a narrow range of around $5,900 – $5,200. The BTC/USD pair formed a decent support above the $5,100 and $5,020 levels.
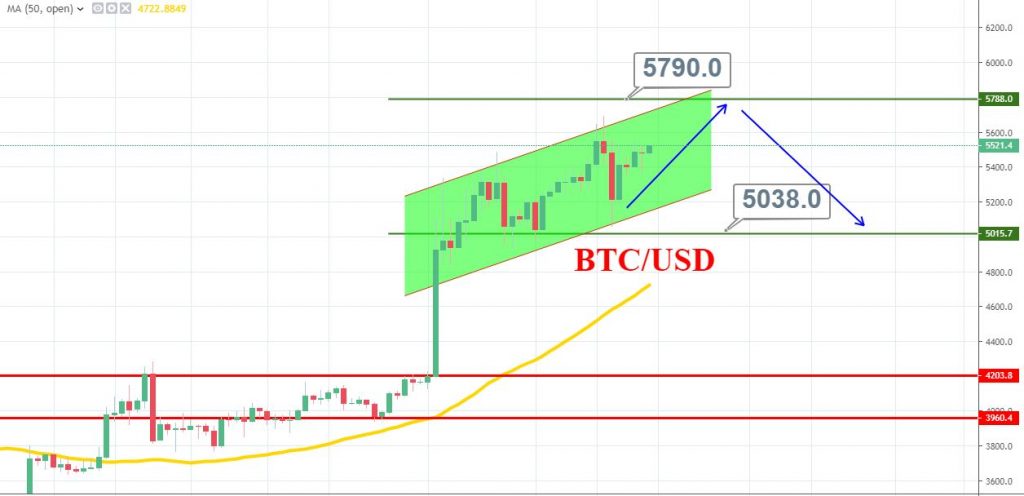
The RSI & Stochastic, both stays over 50, in the buying zone. While the 50 periods EMA is extending solid support around $5,400.
On the 4-hour timeframe, BTC/USD has also formed a bullish channel which is another bullish signal for the leading crypto pair.
- Check out our free forex signals
- Follow the top economic events on FX Leaders economic calendar
- Trade better, discover more Forex Trading Strategies
- Open a FREE Trading Account


