Gold at the 100 SMA Again. Will it Reverse Down From Here?
Gold is facing the 100 SMA again now and this time chances are in favour of a break to the upside
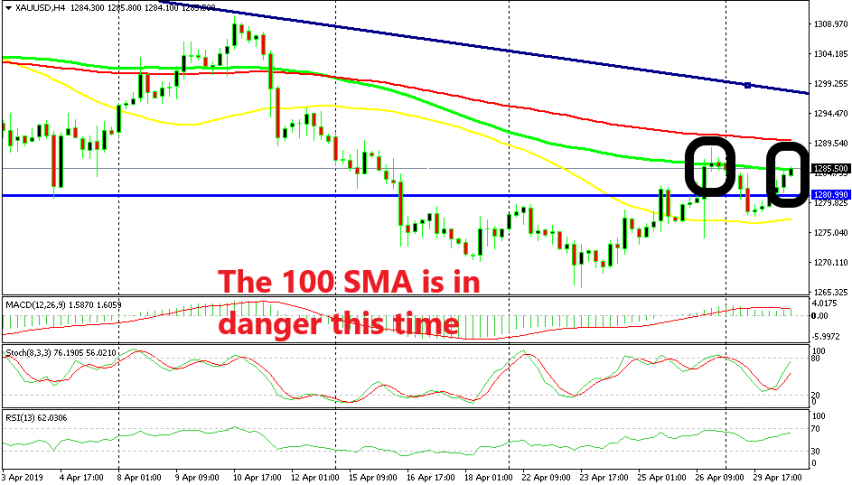
GOLD has turned bearish on long term charts since February when it topped at $1,346. Since then, the pressure has been on the downside obviously, and two weeks ago, it finally broke the support zone around $1,280. But the price returned back up last week as the sentiment got hurt especially after the US GDP report which looked great at first glance, but the details painted a blurry picture.
But, Gold buyers called it a day when they reached the 100 SMA (green) on the H4 time-frame. The price formed an upside-down hammer candlestick right at that moving average which is a reversing signal, especially when stochastic is overbought. The reverse started last Friday and yesterday Gold had a bearish day, which was mostly technical.
But before sellers got too carried away, Gold formed a bullish reversing setup in the US session. The price formed a doji candlestick and that happened right above the 50 SMA (yellow). Then the bullish reversal started form there and now we are back at the 100 SMA.
Will Gold push above the 100 SMA now and stretch the bullish trend further above?
Technical
The reversal above the 50 SMA is a sign that a bullish trend might be forming. This moving average has provided support back in March and now it seems like it’s taking up that job again. Besides, this reversal means that Gold is making higher lows, which is a bullish signal too.
Fundamental
Fundamentally, the Chinese services PMI and particularly the manufacturing reports missed expectations and fell close to stagnation. Last month if you remember, the sentiment improved in financial markets after the economic data from China showed that these sectors came out of contraction. But now we see that they are heading back there again, so perhaps last month was just a fluke, probably a seasonal adjustment?
If that is true, then Gold will likely break above the 100 SMA this time as traders run for safe havens. The buyers are not exactly pushing too much now that they have reached the 100 SMA, but the 100 SMA is not rejecting the price either, so it seems stuck around these levels.
If the break comes, then the target for me will be the descending trend line. That would be a good place to sell GOLD long term, somewhere around $1,300 since it is also a big round level.
- Check out our free forex signals
- Follow the top economic events on FX Leaders economic calendar
- Trade better, discover more Forex Trading Strategies
- Open a FREE Trading Account