The Uptrend is in Threat for S&P500 as MAs Get Broken
Stock markets have turned bearish this week and S&P500 is threatening to break the 50 SMA right now

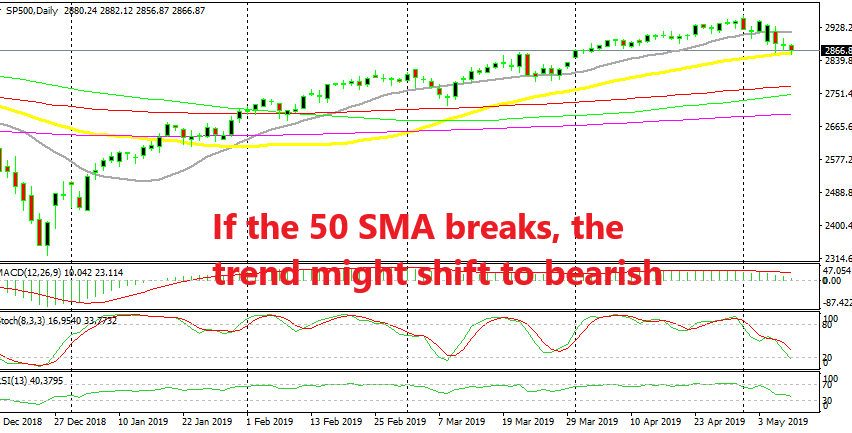
Stock markets have been on a bullish trend since they bottomed at the end of last year, following a terrible Q4 in 2018. As you can see from the daily chart above, the uptrend has been quite straightforward for SPX, with the 20 SMA (grey) providing support as the price pushed higher and defined the uptrend.
The pullbacks lower have been quite minimal during this time, with the deepest one at the beginning of March. That was the only time that S&P broke below the 20 SMA and the price fell nearly 100 points. But the price reversed after forming a pin candlestick which is a bullish reversing signal and the uptrend resumed again.
Now we are seeing another decent pullback, which is the biggest so far since the bullish trend started. The 20 SMA provided support once again at the end of last week but this week opened with a bearish gap lower which took us below the 20 SMA. The pullback lower continued this week and now the sellers are threatening the 50 SMA (yellow). If this moving average breaks, then it will be a strong signal that the uptrend is in real danger.
Yesterday we saw a doji form above the 50 SMA on the daily chart, which is a reversing signal, but we are seeing no reversal today and the 50 SMA is under threat as well now. So, this will be the decisive indicator, break below the 50 SMA and the price will likely remain bearish for the coming days. Otherwise, the uptrend will likely resume if the 50 SMA holds. But, we also have to keep an eye on the China-US meeting which will take place today and tomorrow.
- Check out our free forex signals
- Follow the top economic events on FX Leaders economic calendar
- Trade better, discover more Forex Trading Strategies
- Open a FREE Trading Account


