Weekly Outlook, May 13-17: Key Factors Impacting Gold & Japanese Yen, What’s Next to Expect?
Most of the FX traders are stuck in gold and Yen positions due to sudden and unexpected reversals. Let's see Gold and Yen swing trade plan..
During the previous week, the market was surrounded by the uncertainty over the US-China trade war. The Trump administration executed its threat to inflate tariffs on $200 billion worth of Chinese exports from 10% to 25% earlier on Friday, denoting a sharp escalation in tension between the world’s two largest economies.
The following days could be critical. The US and Chinese moderators concluded another series of discussions on Friday without a settlement to fix American interests on market access and intellectual property theft.
China can’t do much to hurt the US economy due to the fact that it buys far fewer goods from the United States than the other way round. Last year, China inflicted $110 billion worth of tariffs on US exports and leaving roughly $10 billion worth of goods to target now. With that, the uncertainty level remains at a peak, keeping the safe havens gold and Japanese yen supported. As per the market sentiments, most of the forex traders are stuck in gold and Yen positions due to sudden and unexpected reversals. Thereby, I’m gonna share a long term outlook for both of these assets.
Gold – XAU/USD- Weekly Outlook
Gold is trading at 1,285, around the peak of their recent trading range but still striving to gain momentum. There are two major fundamentals driving gold’s momentum in the market.
Trade War – First and the foremost is the US-China Trade War which has driven extensive sell-off in the equity markets. As you know, the stock market and bullions work are considered substitutes for each other.
On Friday, the US inflicted 25% tariffs on Chinese products as there was no eleventh-hour trade deal reached between both nations. What’s scarier is that China has vowed retaliation.
US Consumer Inflation – On Friday, the US Labor Department announced that its Consumer Price Index (CPI) soared 0.3% in April, following a 0.4% increase back in March 2019. Certainly, the figures were weaker than expected, missing the forecasts calling for a 0.4% rise.
GOLD – XAU/USD – Technical Outlook
Gold could extend its bullish trend above $1,300 next week. Why is that?
- Referring to the daily chart, gold is being defended by a long-term moving average price support for the third straight week.
- The relative strength index (RSI) and Stochastics have crossed over 50 midpoints, signaling a bullish bias of traders.
- The support level of 1,265 has remained intact despite being tested twice during the volatile week. However, 1,290 has extended solid hurdle to buyers.

Weekly Support & Resistance
Support Resistance
1267.7 1288.72
1256.5 1298.54
1235.48 1319.56
Key Trading Level: 1277.52
What happens when the current range gets violated?
It depends on whether it’s a bullish or a bearish breakout. Well, let’s discuss both probabilities.
Bullish Breakout – If gold violates 1,290 on the upper side and manages to close a daily candle outside this resistance, we may see a bullish rally until 1,309, 1,322 and 1,342.
Bearish Breakout – Alternatively, the bearish breakout could extend selling until 1,267 and 1,251.
US Dollar & Japanese Yen (USD/JPY) – Weekly Outlook
The US Dollar Index was mostly unchanged versus the safe-haven Japanese yen on Friday. It drove a tug of war between the bulls and bears over hike in US tariffs. The dollar closed a week around 109.940 against yen after slipping to a three-month low of 109.470 overnight.
During the previous week, disappointing US economic events and the US-China trade tensions triggered the demand for a safe haven currency Japanese yen. What’s next on the docket?
The low impact economic events like Bank Lending, Current Account, Economy Watchers Sentiment, and PPI y/y figures will be in highlights. However, the developments on trade war will continue to dominate the safe haven pair USD/JPY in the coming week.
US Dollar & Japanese Yen ( USD/JPY ) – Technical Outlook
Last week, the USD/JPY lost over 160 pips on the back of safe-haven demand and weaker US dollar. If you remember, the pair opened with a huge gap and slipped from 111.102 to 109.470 due to strong bearish power.
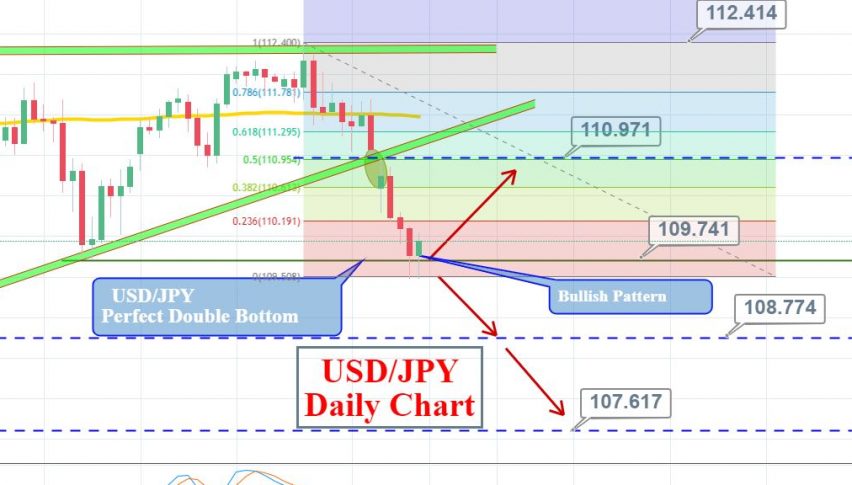
On the daily chart, the USD/JPY’s recent candle close double bottom support of 109.4050. Candle’s formation is half bearish and half bullish, suggesting a phase of indecision among bulls and bears. Typically, this kind of candle triggers a bullish reversal, especially if its followed by a sharp bearish trend.
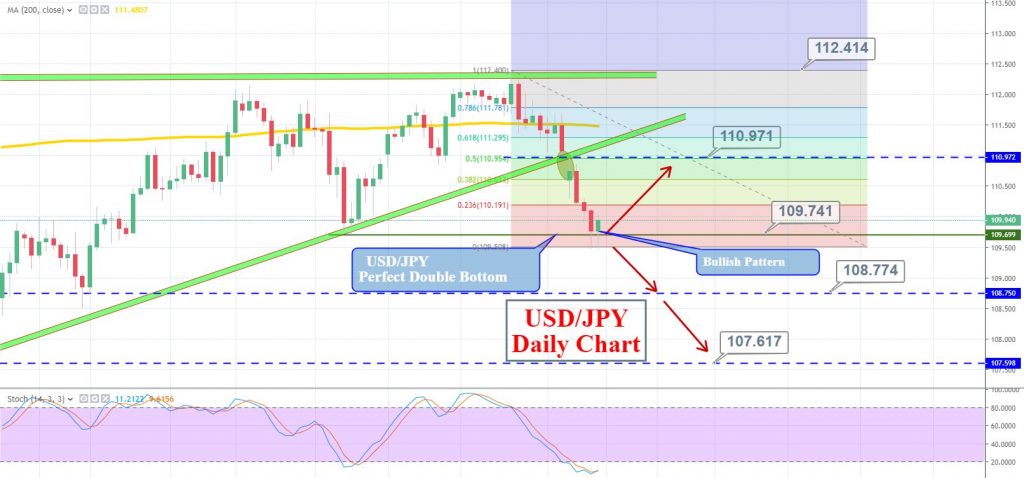
Speak of the leading and lagging indicators, both are in favor of a bullish retracement. The 200 periods moving average stays around 111.500 level which is too far from the current market price. So definitely there’s a room for a bullish retracement.
Let’s apply the Fibonacci indicator to find out potential target levels upward. Well the USD/JPY can target 110.190 (23.6% Fibo Retracement) and 110.600 (38.2% Fibo Retracement). Whereas, the 50% retracement completes around 110.950.
On the lower side, a bearish breakout of double bottom support 109.740 can extend bearish trend towards 108.750 and 107.600.
Weekly Support & Resistance
Support Resistance
110.8 111.65
110.5 112.2
109.65 113.05
Key Trading Level: 111.35
In the upcoming week, I would consider staying bullish above 109.450 to target 110.950 and then can take a sell position below 111.250. Whereas, sell-stops below 109.500 with a take profit of around 108.750 can also help to secure profits.
Traders, I hope you liked the analysis. Feel free to post your questions in the comment box below as team FX Leaders is always here to help you out. Have a profitable week!
- Check out our free forex signals
- Follow the top economic events on FX Leaders economic calendar
- Trade better, discover more Forex Trading Strategies
- Open a FREE Trading Account
- Read our latest reviews on: Avatrade, Exness, HFM and XM
Related Articles


Sidebar rates
Related Posts
