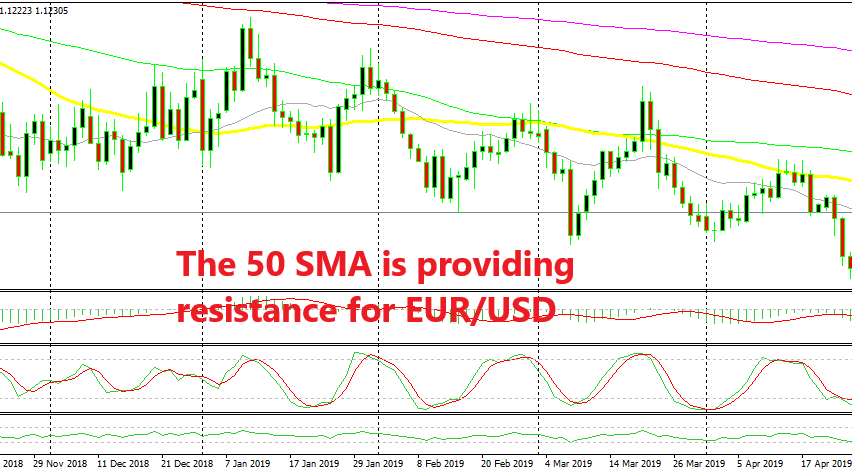
The 50 Daily SMA Keeps the Downtrend in EUR/USD
EUR/USD has been on a downtrend for more than a year since it reversed at 1.2550s last spring and the pressure has been on the downside since then. The pace has slowed since last summer and this pair even formed a bottom for several months at 1.1260-70, but that support was broken and the bearish trend resumed again.
Although, the sellers haven’t been able to push too low since then and even though EUR/USD has made new lows, the attempts at the downside have been pretty weak. But the bearish trend remains in place since the highs keep getting lower, meaning that the buyers are giving up sooner each time and the sellers remain in charge.
The last pullback higher took place last moth, but it ended right at the 50 SMA (yellow) on the daily chart and the downtrend resumed after the price formed a few reversing signals up there. Now we are in a similar situation with EUR/USD having retraced higher in the last two weeks.
But it seems that the 50 SMA is holding on again as the price has found resistance at this moving average in the last two trading days. Besides that, the previous support at 1.1260-70 is also adding some more strength to the 50 SMA which is acting as resistance and the stochastic indicator is almost overbought. This means that the pullback is almost complete and the bearish trend should resume soon. Although, the sentiment is sort of negative in financial markets right now and there’s quite some uncertainty so I don’t think the reversal will take place today. But, we’re following this pair to get the timing right for a sell forex signal close to the 50 SMA.


