Trading the 15 Minute Chart in AUD/USD As the Downtrend Accelerates
AUD/USD has retraced higher on the 15-minute chart, but the bearish trend is pretty strong so we decided to go short on this pair
[[AUD/USD]] turned pretty bearish since the middle of April and the bearish trend is picking up pace this week as the sentiment in financial markets turns even more negative on escalating trade conflict between the US and China. Retraces higher have been pretty weak on normal charts such as the H1 time-frame, especially this week.
So we decided to trade the smaller period charts such as the 15-minute chart. In the last couple of hours, this pair put up another weak pullback higher which seems similar to the precious pullbacks. So we decided to go short on AUD/USD and not wait for a deeper pullback on larger time-frames.
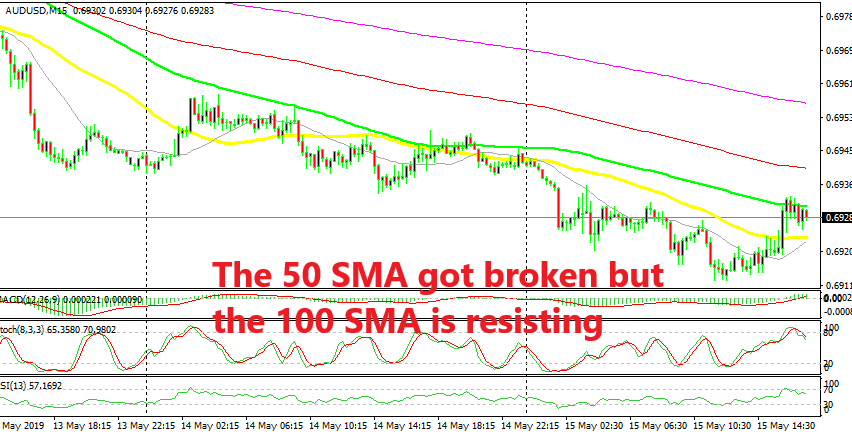
The price reached the 50 SMA (yellow) on the 15-minute chart which provided resistance for abut an hour. The price also formed several doji and upside-down hammer candlesticks, which are reversing signals after the retrace. Although, the stochastic indicator is not overbought yet, so the retrace is not complete, but we went short on this pair anyways because the sentiment continues to be negative.
Although, the 50 SMA has been broken meanwhile, but the 100 SMA (green) is providing solid resistance. If you switch to the 30 minute chart, you will see that the 50 SMA is doing also a good job in that time-frame and now the price is reversing back down.
- Check out our free forex signals
- Follow the top economic events on FX Leaders economic calendar
- Trade better, discover more Forex Trading Strategies
- Open a FREE Trading Account