U.S. Indices Lag On Wall Street Open
This week’s volatility on Wall Street has been extreme, with no index feeling the heat more than the NASDAQ.
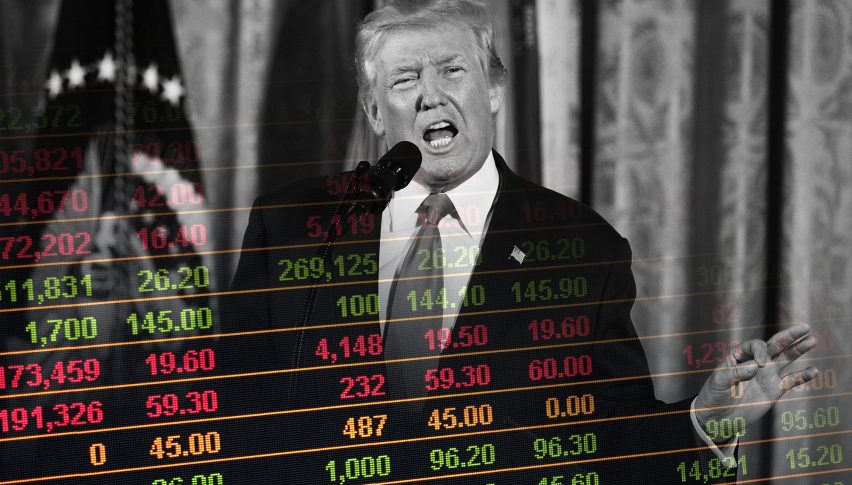
The rocky road for U.S. stocks has continued today, featuring opening losses in the DJIA DOW, S&P 500 SPX, and NASDAQ. Following a nice Tuesday rebound, investors are once again hesitant to go long equities due to the ongoing trade war saga and a weaker-than-expected group of U.S. economic metrics. Early action on Wall Street has been choppy and dominated by bearish sentiment.
During the U.S. pre-market hours, several economic reports were released to the public. Here is a quick look at the data:
Event Actual Projected Previous
NY Empire State Manufacturing Index (May) 17.8 8.5 10.1
Retail Sales (MoM, April) -0.2% 0.2% 1.7%
Retail Sales except Autos (MoM, April) 0.1% 0.7% 1.3%
Industrial Production (MoM, April) -0.5% 0.0% 0.2%
The headliner of this group is the slump in U.S. Retail Sales from April. Performance of the retail sector in the United States has been questionable since last December’s record low output. Since then, the numbers have been looking better, but today’s group of figures has done little to spike the confidence of the markets.
On a more positive note, the NY Empire State Manufacturing Index for May has come in extremely strong. This is a good sign for East Coast economic growth as the summer season draws near.
Another Red Open For The NASDAQ
This week’s volatility in U.S. stocks has been extreme, with no index feeling the heat more than the NASDAQ. Following an epic Monday crash and solid Tuesday buy-back, June E-mini NASDAQ futures are once again under pressure.
++5_15_2019.jpg)
For the next few sessions, there will be two levels on my radar:
- Resistance(1): 38% Current Wave Retracement, 7512.50
- Support(1): Swing Low, 7290.00
Bottom Line: As long as the June E-mini NASDAQ trades below the 38% Fibonacci Retracement (7512.50), then the daily bearish trend remains valid. However, if we see a rally in the next several days, the 7512.50 area is prime trade location to the short.
Until elected, I will have sell orders queued up from 7508.75. With an initial stop at 7517.75, this trade produces 35 ticks on a slightly sub-1:1 risk vs reward management plan.
- Check out our free forex signals
- Follow the top economic events on FX Leaders economic calendar
- Trade better, discover more Forex Trading Strategies
- Open a FREE Trading Account