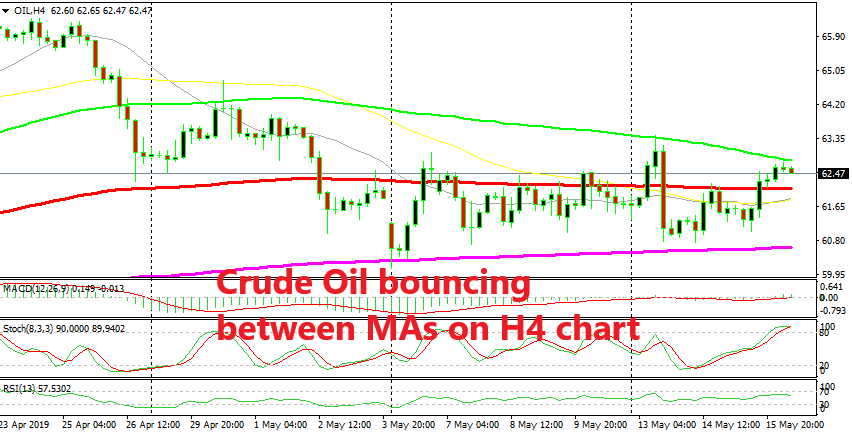
US Crude Oil Trades in a Range Between MAs
US crdue Oil turned bearish at the end of April, but it has been stuck in a range in the last two weeks

Crude Oil turned bearish at the end of last month after being on a bullish trend since the start of this year. US WTI crude peaked at $66.50s but now it is trading above the $60 level after losing several hundred of pips in the last week of April and the first week of this month.
The low print on my platform comes at $60.10, so it seems that the round level at $60 has turned into support now for Oil. At least it scared the sellers away a first attempt, which means that traders are aware of it. Although, the 200 SMA (purple) has also down a good job in providing support.
The price has turned bullish above this moving average and now US WTI Crude Oil is trading between this moving average and the 100 simple MA (green) on the H4 chart, with the 100 smooth MA (red) standing in the middle and acting as resistance quite a few times in these last two weeks.
So, it’s this range we should watch in Crude Oil. If the 200 SMA breaks to the downside, then it will be a signal that sellers are back in. That might be a possible scenario and it might happen soon if the sentiment continues to deteriorate over an escalating trade war between the US and China and probably the EU soon.
- Check out our free forex signals
- Follow the top economic events on FX Leaders economic calendar
- Trade better, discover more Forex Trading Strategies
- Open a FREE Trading Account


