Gold Now Facing the 100 SMA
Gold turned bearish but was finding support at the 100 SMA for a few sessions, which was broken earlier
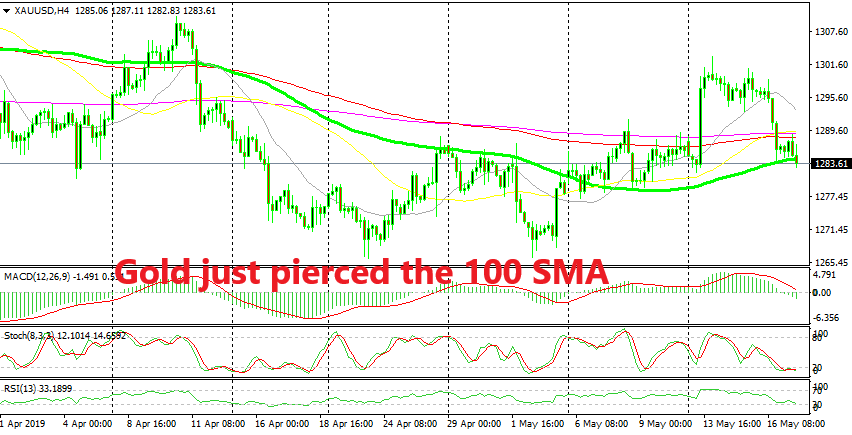
GOLD has been pretty bullish in the last two weeks, although the main trend remains bearish after the reversal we saw back in February at $1,346. Although, during this reversal, Gold found resistance at the 100 SMA (green) first two weeks ago which then turned into support last week as you can see from the H4 chat above.
Then, the 200 SMA (purple) provided resistance during last week, which got broken on Monday. I though yesterday when the price was reversing back down that the 200 SMA would turn into support now, but that wasn’t the case. We saw a sudden and strange improvement in market sentiment yesterday, which is a negative thing for safe havens and Gold broke the 200 SMA without much resistance.
Today, it seems that the 200 SMA has turned into resistance for Gold. But the 100 SMA turned into support for some time. That moving average held since late US session yesterday but was broken a while ago. Now this moving average should be a good place to sell Gold as i expect it to turn into resistance again.
- Check out our free forex signals
- Follow the top economic events on FX Leaders economic calendar
- Trade better, discover more Forex Trading Strategies
- Open a FREE Trading Account