Weekly Crypto Roundup
Bitcoin and other cryptos are unstoppable!
Bitcoin and other cryptos are unstoppable! While the recent correction can be seen as a great entry level for everyone who missed the boat, we should look where Bitcoin and the cryptocurrency market are heading next by looking at the technical analysis.
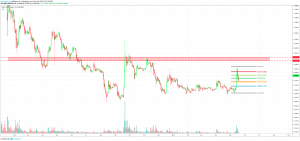
BTC/USD DAILY CHART
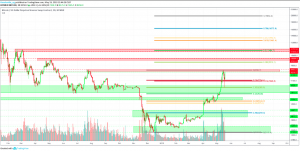
Bitcoin rallied all the way up to $8,400 and experienced a flash crash afterward, ranging down to $6,400, where it bounced off the 0.382 fib level, which is very bullish. With it currently being at $8,140, Bitcoin is on its way to the prior resistance at $8,400. As the likelihood of breaking the resistance is rather high, Bitcoin faces its next resistance at around the $10,000 mark. Once broken, Bitcoin will head to $12,000 and ultimately to $13,500, where Bitcoin is likely to initiate a major retracement, as the golden ratio fib extension level of the entire bear market is located at this price level. If Bitcoin turns bearish, it finds major support at the $6,000 mark. For now, an uptrend seems very likely.
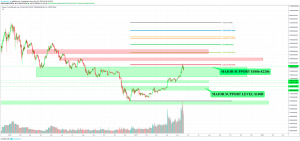
ETH/USD DAILY CHART
Ethereum only retraced down to the 0.236 fib level after surging to $278, where it faced a minor resistance. With the current outlook, Ethereum should be on its way to the major resistance at $360-$420. In case of a bearish turn, Ethereum finds major support at the $200 mark.
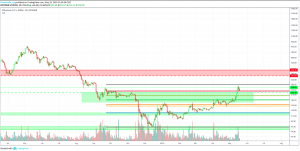
TOTAL CRYPTO MARKET / USD DAILY CHART
The cryptocurrency market turned the major resistance between $180b-$220b into support, after being rejected at the 0.236 fib extension level. As long as the support holds, the total market capitalization should be on its way to $280b-$300b very soon, where a small pullback seems likely. After that, the market is probably straight on its way to the $340b mark, where the 0.382 fib extension level is located at.
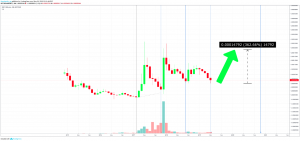
XRP/USD DAILY CHART
XRP turned extremely bullish this week. After surging by 64 percent, XRP reached $0.48226 where it initiated a retracement. With it perfectly bouncing off the golden pocket, XRP should be on its way to the next resistance between $0.53 and $0.57. If not, XRP finds its next support at around $0.40.
XRP/BTC MONTHLY CHART
The XRP/BTC monthly chart caught my attention, as I discovered a very interesting pattern. When applying the Fibonacci time zones, it can be observed that the Fibonacci lines are located exactly at the very low before one to three very bullish, green monthly candles have followed. With the current bullishness of the market, this pattern hints at XRP outperforming Bitcoin by far in the upcoming months. It is definitely worth keeping an eye on the price development of XRP.
The biggest gainers of this week were
Matic Network, which surged by 270 percent,
NEM, which rose by 89 percent, and
Bittorent, which gained by 75 percent.
There were rumors this week that eBay is going to accept cryptocurrency payments, however, eBay declined the rumors. What’s more, Lucien Chen, the CTO of the TRON foundation announced to leave TRON, as he thinks that it is not in conformity with the original idea of the blockchain start-up anymore, to establish a decentralized internet.
- Check out our free forex signals
- Follow the top economic events on FX Leaders economic calendar
- Trade better, discover more Forex Trading Strategies
- Open a FREE Trading Account
- Read our latest reviews on: Avatrade, Exness, HFM and XM
Related Articles

Sidebar rates
Related Posts
