The Retrace Up Might End Here for USD/JPY as it Faces the 100 SMA on 2 Different Charts
USD/JPY has been retracing higher since last week, but the retrace should be over soon

[[USD/JPY]] turned bearish at the beginning of this month as the sentiment turned negative after the trade war escalation. Safe havens benefit when the sentiment turns negative and, as a result, USD/JPY headed down. It opened with a bearish gap lower two weeks ago and it continued further down, losing around 250 pips that week.
The trade war has escalated further and it is getting worse, but the sentiment hasn’t deteriorated too much last week and this week so far, hence the retrace higher in this pair and in stock markets during this time. USD/JPY has pulled back up but the retrace might be over now as this pair faces the 100 SMA (green) on the H4 chart as you can see above.
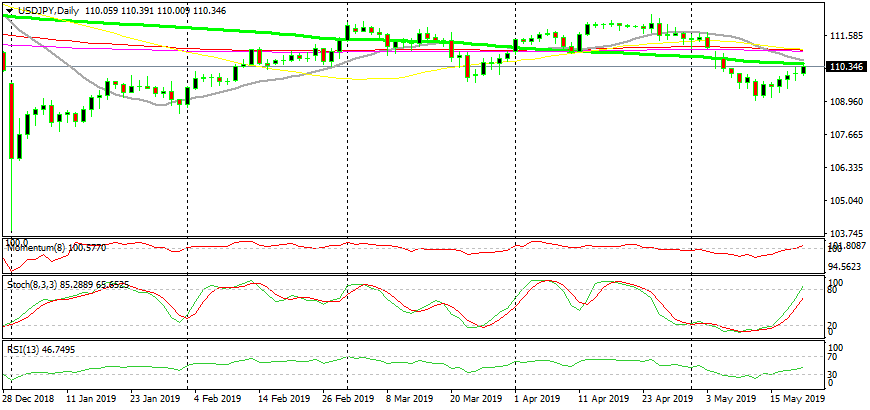
USD/JPY facing the 100 SMA on the daily chart as well
If we switch to the daily time-frame, we see that USD/JPY is facing the same moving average. This moving average provided support last month, so there’s a good chance that it now turns into resistance. The stochastic indicator has just become overbought as well, so the pullback is complete on the daily chart.
Now I’m thinking about selling this pair since the trade war is set to escalate further as China made it clear today that it is not bluffing. This looks like a good place to sell, but let’s wait for a reversing signal first before going short.
- Check out our free forex signals
- Follow the top economic events on FX Leaders economic calendar
- Trade better, discover more Forex Trading Strategies
- Open a FREE Trading Account


