US WTI Crude Continues to Find Support at MAs
Crude Oil turned slightly bullish again last week, and the MAs are providing support for US WTI crude
Crude Oil prices have been bullish all year after they made a reversal at the end of 2018, following three months of great selling pressure. The reversal took place due to OPEC+ deal to cut production as well as due to improving sentiment as US and CHina were heading towards a trade deal.
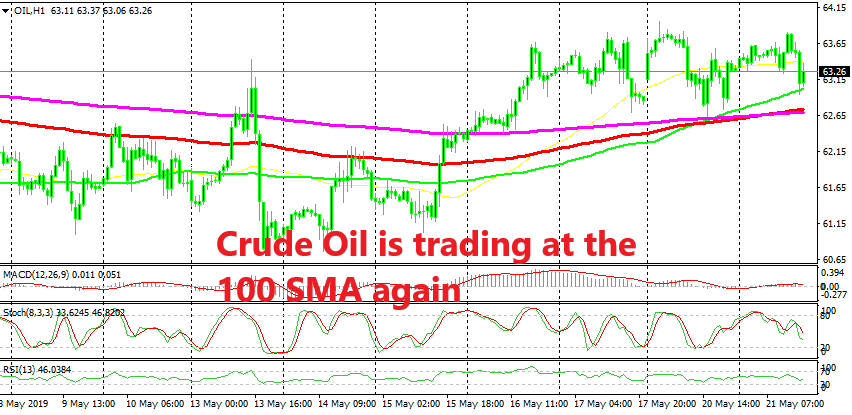
But we saw a bearish reversal at the end of April with US WTI crude losing more than $5 in less than two weeks. But the decline stopped above $60 and last week WTI crude turned bullish after trading in a range. During the time Oil traded in the range, the 100 SMA (red) and the 200 SMA (purple) provided resistance.
But they turned into support after being broken. The 200 SMA provided support immediately after being broken to the upside last week and again yesterday on the H1 chart. The 100 SMA (green) also added some strength as it was coming at the same level. Now we see that the 100 SMA has taken things in its hands as it provides support again while moving higher. So, if you want to trade Oil, look how the price behaves around the MAs, now around the 100 SMA (green). If hey hod, then go long, if not, then the trend might be changing.
- Check out our free forex signals
- Follow the top economic events on FX Leaders economic calendar
- Trade better, discover more Forex Trading Strategies
- Open a FREE Trading Account


