GBP/USD Forms A Selling Pattern on H1 Chart
GBP/USD has retraced higher this morning but it has reached the 20 SMA now which has been pushing this pair down
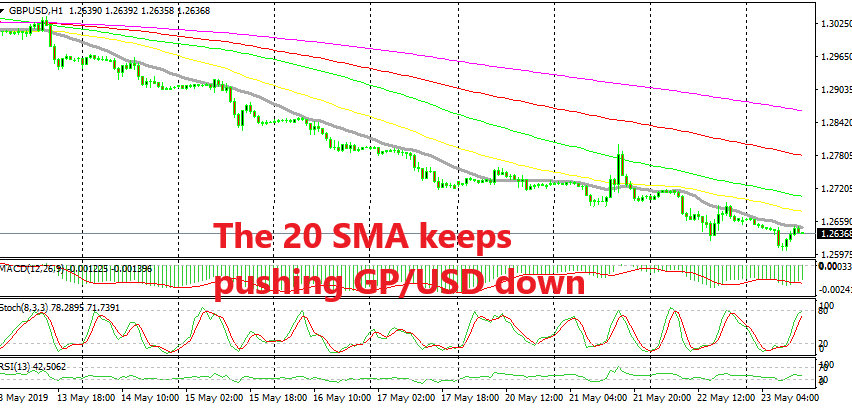
[[GBP/USD]] has been on a bearish trend throughout this month, having lost nearly 600 pips from top to bottom as the odds of UK ending up with a Brexit deal keep going down. The trend has been very consistent, apart from the time when this pair jumped more than 100 pis higher on Tuesday after Theresa May’s spokesman said that May was going to come up with some new proposals that day, which turned out to be nothing interesting for UK lawmakers, who are now pushing for May to leave the post.
Eventually the price turned back down as that changed nothing regarding Brexit or the GBP and this pair resumed the bearish trend stretching it further to the downside. During the last two week, the 20 SMA (grey) has been providing resistance, pushing the price down, apart from Tuesday when the 100 SMA (green) stopped the climb.
This morning, the price continued further below during the Asian session but in the last few hours we have been seeing a retrace higher. Although, the retrace is complete now that the stochastic is almost overbought and the price has reached the 20 SMA again which is providing resistance already. So, the chart looks set for another bearish reversal bat the 20 SMA, so we decided to go short on EUR/GBP. Now we are waiting for the reversal to come.
- Check out our free forex signals
- Follow the top economic events on FX Leaders economic calendar
- Trade better, discover more Forex Trading Strategies
- Open a FREE Trading Account
- Read our latest reviews on: Avatrade, Exness, HFM and XM
Related Articles

Sidebar rates
Related Posts
