US WTI Crude Breaks the 100 Daily SMA As Global Economy Weakens Further
Crude Oil has broken all moving averages on the daily chart, stretching the downtrend further
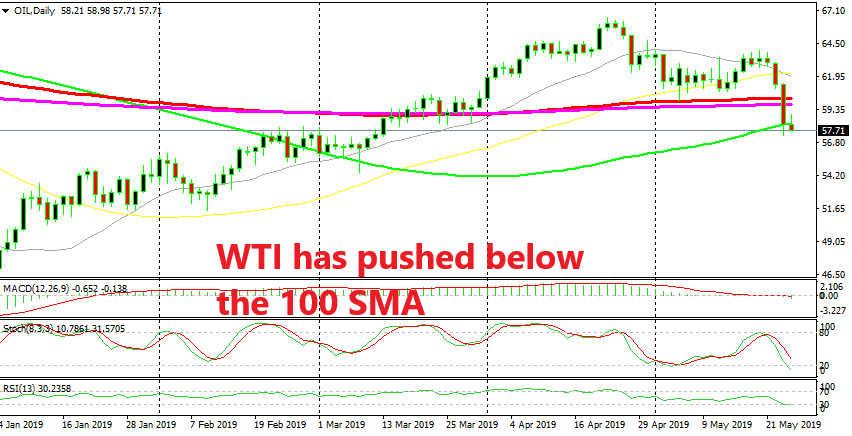
Crude Oil turned bearish at the end of last month but it tried to resume the bullish trend during this month. Although, the buyers couldn’t get things back in their hands and after forming a couple of doji candlesticks which are a reversing signal, the declined resumed and US WTI crude lost more than $6 during this time.
The price broke below the 100 SMA (red) and the 200 SMA (purple) yesterday which stand around the $60 level and that was a big signal that the trend was shifting. The decline stretched further down and the price also pierced the 100 simple MA (green), but it pulled back up and closed above that moving average.
Today though, the 100 SMA has moved above and the price has slipped below it. If it closes below the 100 SMA, then this will be another sign that the trend has changed. OPEC+ is to meet sometime soon and I’m sure they will decide to keep production restriction quotas in place, but the global economy has slowed down considerably and the big decline yesterday came after the soft US manufacturing and services reports and it is slowing even more, so demand for Oil will decline likely further. But, let’s see where we go from here.
- Check out our free forex signals
- Follow the top economic events on FX Leaders economic calendar
- Trade better, discover more Forex Trading Strategies
- Open a FREE Trading Account