GBP/USD Trades Between 2 MAs
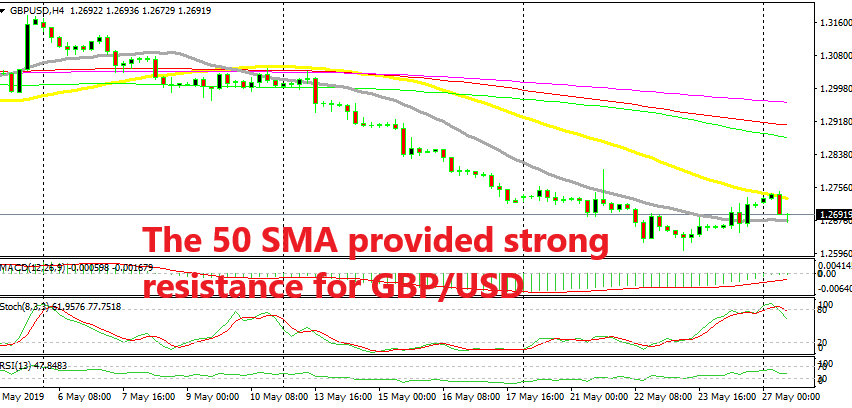
GBP/USD has retraced higher since Thursday but the retrace seems to have ended at the 50 SMA
[[GBP/USD]] turned bullish towards the end of last week after some really weak economic reports from the US. Although, the main trend is still bearish for this pair as it lost nearly 600 pips in the last two weeks, declining from below 1.32 to 1.26, and the fundamentals still point down.
The UK economy is in a soft spot along with the rest of the major global economies and Britain is heading out of the EU with no deal. Theresa May gave it all she had but the UK Parliament rejected all her Brexit proposals and now she is on the way out. So, fundamentals seem to be getting worse for the GBP.
The retrace of the last several sessions seems to be around the 20 SMA (grey) on this time-frame chart. It ended at the 50 SMA (yellow) which provided solid resistance during the Asian session. The stochastic indicator became overbought and it is now reversing down, which means that the pullback higher is complete on the H4 chart.
But the price is finding resistance at the 20 SMA (grey) on this time-frame which will decide whether the retrace higher continues, or if the larger bearish trend will resume. We will follow the price action to see how this pair behaves around the 20 SMA now, because it will decide on the future of the bearish trend.
- Check out our free forex signals
- Follow the top economic events on FX Leaders economic calendar
- Trade better, discover more Forex Trading Strategies
- Open a FREE Trading Account


