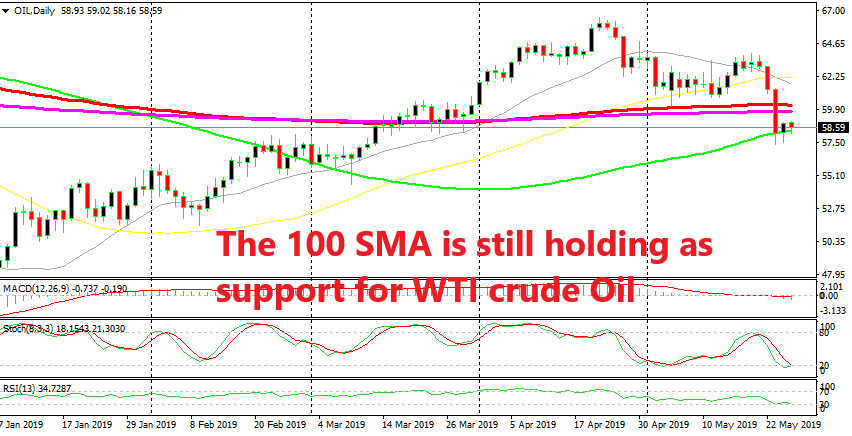
US WTI Crude Still Hesitating at the 100 Daily SMA
Crude Oil made a strong bearish move at the end of last week, but it has been finding support at the 100 SMA for three days

Crude Oil turned bearish in the last week of April after forming a few doji and spinning top candlesticks at $66.50s which are reversing signals. The reversal in the US WTI crude came after that and the price fell to $60. But the big round level, aided by the 100 SMA (red) on the daily chart, proved to be too much for sellers and we saw a bullish reversal this month.
But the climb was pretty slow which shows the vulnerability of the buyers. At the beginning of last week, the price formed a few doji candlesticks again and after the soft economic reports we saw last week, the price tumbled back down again breaking the $60 level and the moving averages.
The world economy has softened considerably so the demand for energy is declining and now it is not sure if OPEC+ will extend production quotas, as Kuwait’s Oil Minister commented just now. So, the fundamentals point down for Crude Oil, but the 100 SMA (green) is not letting go just yet. The price has pierced it a few times but the daily candlesticks have closed above it eventually, so it is holding as support.
The stochastic indicator is also oversold on this time-frame which might bring a retrace higher before the next bearish move. But we will see how the price reacts here around the 100 SMA now. If this moving average holds as support,then we might see another retrace higher, otherwise, the next target for WTI Crude Oil is the $50 level.
- Check out our free forex signals
- Follow the top economic events on FX Leaders economic calendar
- Trade better, discover more Forex Trading Strategies
- Open a FREE Trading Account


