EUR/USD Finds Support at MAs
EUR/USD turned bearish at the end of last week, but it is trading between 2 MAs now
[[EUR/USD]] has been bearish for several weeks, but it turned bullish at the end of last week, after the soft manufacturing and services reports from the US. The US Dollar reversed to turn bearish on Thursday and EUR/USD bounce off the support above 1.11 once again, climbing more than 100 pips.
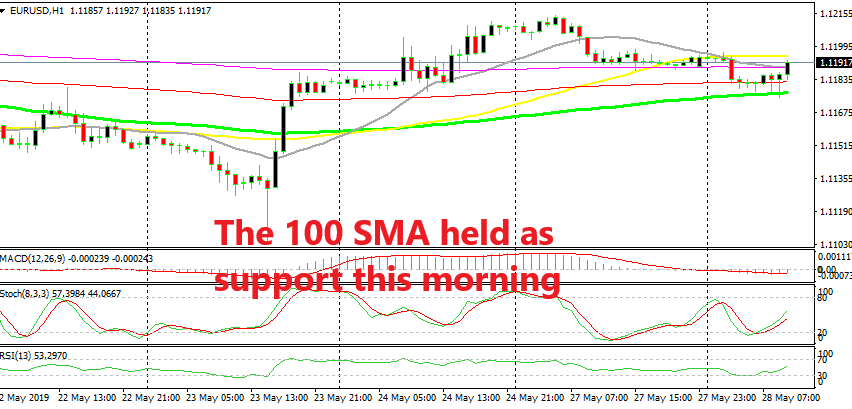
Although, this pair started retracing lower yesterday after finding resistance at the 100 SMA (red) on the H4 chart, as you can see below. The price slipped below 1.12 but it has been finding support at the 100 SMA (green) on the H1 time-frame all morning and after forming several hammer and doji candlesticks which are reversing signals, we are seeing a small bounce.
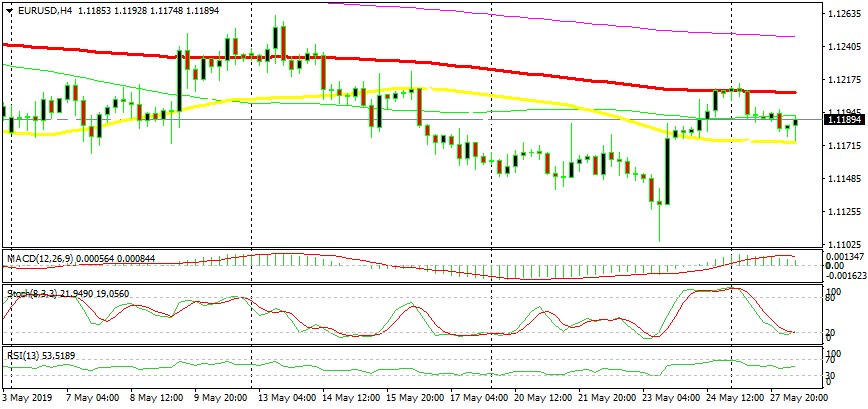
On the H4 chart, it’s the 50 SMA which is providing support
On the H4 chart, we have the 50 SMA (yellow) standing at 1.1175 where the 100 SMA comes at the H1 chart. This moving average added extra strength to the support at 1.1175 and we are seeing a bounce after the pin candlestick which is another reversing signal. The stochastic indicator is also oversold, so it is time for a bullish move.
Although, we will see if the bullish trend of the last few days will remain in place. The range between the two MAs will decide the fate of this pair. A move above the 100 SMA (red) will keep the buyers in charge while a slip below the 50 SMA (yellow) will keep sellers in control.
- Check out our free forex signals
- Follow the top economic events on FX Leaders economic calendar
- Trade better, discover more Forex Trading Strategies
- Open a FREE Trading Account


