Shorting the Pullback in USD/CAD at the 50 SMA
USD/CAD has retraced higher this week, but it has formed a bearish reversing pattern now, so we decided to go short on this pair
Last week was pretty bearish for USD/CAD as the USD turned weakened after a series of really weak economic data from the USD. The USD lost considerable ground against major currencies and this pair lost more than 300 pips from top to bottom. The main trend on the daily chart is pretty bearish, but this was a really decent pullback and now the trend is bearish on the H4 chart.
This week though, USD/CAD has retraced higher, helped also by the decline in Crude Oil prices. Yesterday we saw Oil buyers try the upside during the Asian session as Oil climbed nearly $3 higher after an explosion on two Iranian Oil tankers in the Gulf. But, that didn’t last long and the buyers resumed control.
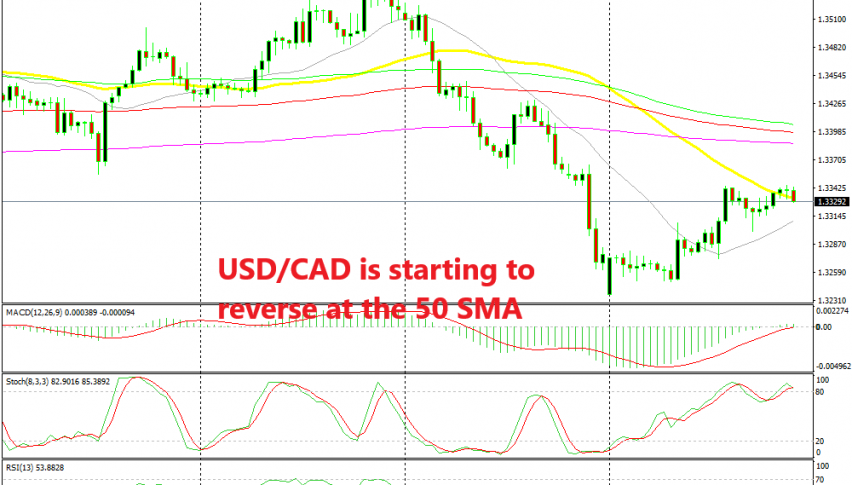
Although, the price has reached the 50 SMA (yellow) now and it is finding resistance there on the H4 chart. The stochastic indicator is also overbought which means that the pullback higher is complete. The last two H4 candlesticks closed as small dojis which are reversing signals, so we decided to go short on this pair based on this chart setup.
On the H1 chart, we have the 100 SMA (red) provide resistance in the last three days, so that goes in favour of our trade here. But, let’s hope the US retail sales report which will be released later today won’t ruin this trade.
- Check out our free forex signals
- Follow the top economic events on FX Leaders economic calendar
- Trade better, discover more Forex Trading Strategies
- Open a FREE Trading Account


