Selling the Pullback at the 20 SMA in AUD/USD as the Trend Picks Up Pace
AUD/USD has retraced higher but the pullback seems complete on the H1 chart, so we decided to go short on this pair
[[AUD/USD]] has turned into a great pair to sell. The global economy has slowed considerably and the Chinese economy has slowed too, which has weakened the demand for raw materials – one of the main exports from Australia. The Reserve Bank of Australia cut interest rates in the last meting and they said that they will cut again if the FED does. The odds of the FED cutting interest rates in July are pretty high, somewhere above 80% the last time I checked at the end of last week. So, the chances are that the RBA will cut interest rates again as the trade war precipitates.
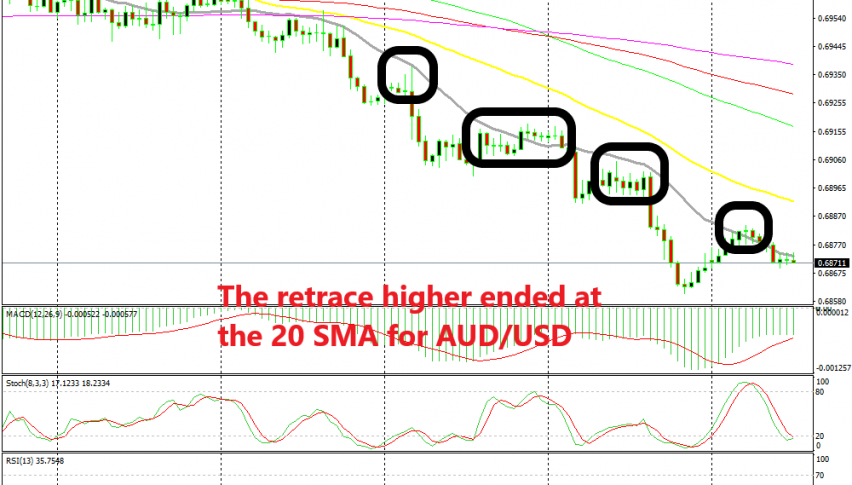
That’s the main reason the Aussie has turned bearish and we have had a few winning signals in this pair, after selling the pullbacks higher. This morning we spotted another pullback which was complete at the 20 SMA (green). I would have normally liked to sell at the 50 SMA (yellow), but the trend has picked up pace recently and the retraces higher end at smaller period moving averages when the trend is strong.
We have seen this pair turn bearish again at the 20 SMA in the last three days and this morning was another of those occasions. The stochastic indicator became overbought when the price reached the 20 SMA on the H1 chart and the price formed a few doji-pin candlesticks up there, which are reversing signals. So, the signs were telling us that the retrace was going to end at the 20 SMA once again and we decided to go short. Now the downtrend is resuming, so we are keeping this trade.
- Check out our free forex signals
- Follow the top economic events on FX Leaders economic calendar
- Trade better, discover more Forex Trading Strategies
- Open a FREE Trading Account
- Read our latest reviews on: Avatrade, Exness, HFM and XM
Related Articles


Sidebar rates
Related Posts
