The 50 SMA Has Turned Into a Great Indicator to Buy AUD/USD
AUD/USD has turned bullish since last Wednesday and the 50 SMA is pushing this pair higher,
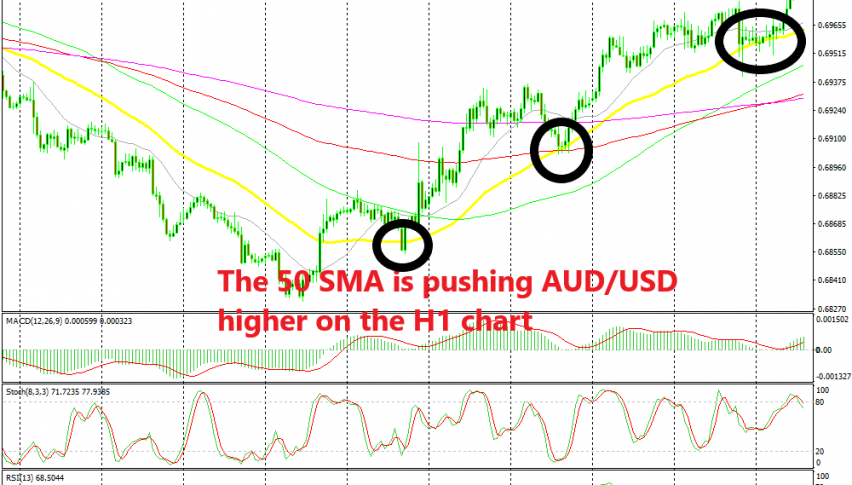
Just like EUR/USD, AUD/USD has turned bullish this month. Although, the real reversal came last week after the FED meeting last Wednesday, because the first bullish reversal in the first week of this month ended at the 50 SMA (yellow) on the daily chart and this pair reversed back down in the following week, making new lows after the Reserve Bank of Australia cut interest rates.
Although, the FED sounded pretty dovish n the last meeting and the USD turned bearish after odds of a rate cut from the FED have gone up close to 100% for next month. As a result, AUD/USD has turned bullish, despite a worsening sentiment in financial markets, a slowdown in the global economy, and the escalating tariffs war between US and China.
During the decline in the second week of this month, the 20 SMA (grey) was providing resistance for this pair and pushing the price lower, which shows that the trend was pretty strong back then. Last week, the trend shifted to bullish and the 50 SMA (yellow) has been providing support since then.
The 50 SMA is a small period moving average, compared to the 100 and 200 SMAs, so the uptrend is also strong. The last time the 50 SMA provided support was yesterday/today before the price climbed higher again, but it is starting to reverse back down now. If the price falls down to the 50 SMA again, then we might try to open a buy signal here, after we get a reversing indicator such as a pin/doji candlestick.
- Check out our free forex signals
- Follow the top economic events on FX Leaders economic calendar
- Trade better, discover more Forex Trading Strategies
- Open a FREE Trading Account
- Read our latest reviews on: Avatrade, Exness, HFM and XM
Related Articles


Sidebar rates
Related Posts
